Commonwealth Bank - Cyber Fraud Detection with Splunk
As a cybersecurity generalist at Commonwealth Bank, you play a key role in defending against the growing threat of financial fraud.
Financial fraud poses a significant challenge for any financial institution, and it is important for Commonwealth Bank to stay up to date with the latest fraud detection technologies and strategies to minimize risk. Protecting against and responding to fraud is a major responsibility for you and your team. By detecting and stopping fraud, the bank can protect its customers, employees and reputation while also enhancing the resilience of its financial system.
During this cybersecurity job simulation, you’ll gain hands-on experience analyzing data, detecting fraud, and building dashboards to support decision-making. I strongly recommend trying this lab out anytime here.
Scenario
Your manager has asked you and the data analytics team to create a model that will predict or detect fraud using customer data from Commonwealth Bank. This model will help identify fraud more accurately and efficiently, while also protecting customers, employees and bank’s reputation.
You’ll use Splunk to build a dashboard that makes it easy to identify patterns and trends given a dataset. The dashboard should provide crucial reporting and metrics information that can help in identifying and detecting financial fraud. By using this dashboard, the team will be able to quickly spot any suspicious activity and take action to prevent fraud from occurring.
Your Splunk dashboard must include the following charts/tables:
- Total number of Transactions.
- Fraudulent vs. Non-Fraudulent Transactions.
- Number of Transactions by Transaction Category.
- Number of Transactions by Fraudulent Payments.
- Number of Transactions by Age.
- Number of Transactions by Merchant.
- Fraud Cases by Transaction Category.
- Fraud Cases by Age.
- Fraud Cases by Month.
- Fraud Cases by Gender.
- Fraud Cases by Merchant.
- Gender with the most fraudulent activity by Transaction Category.
- Age group with the most fraudulent activity by Merchant.
About the Dataset
The dataset you’re going to work with has been carefully curated by the Fraud Team. It contains payment records from multiple customers, made at different times and for various amounts. Each record includes the following features:
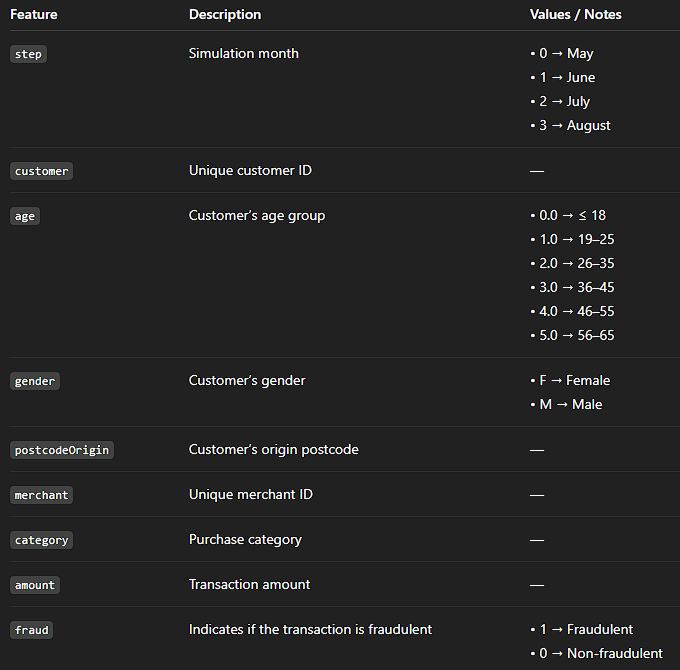
Here’s a small sample of the dataset:
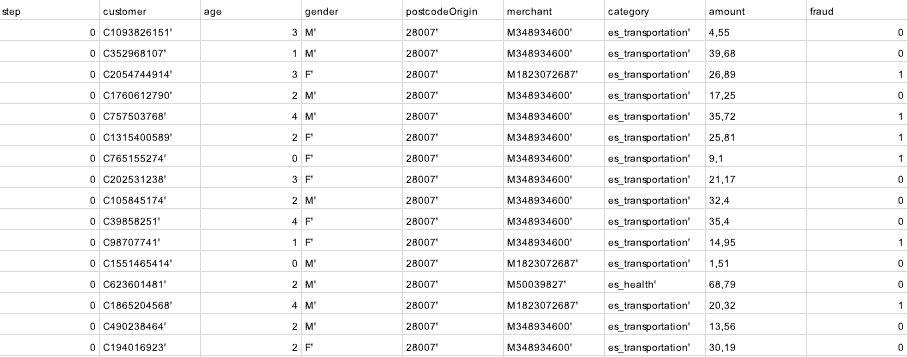
The assignment wants you to analyze fraud patterns. Each visualization will help reveal who, where, and when fraud happens.
Transaction Metrics
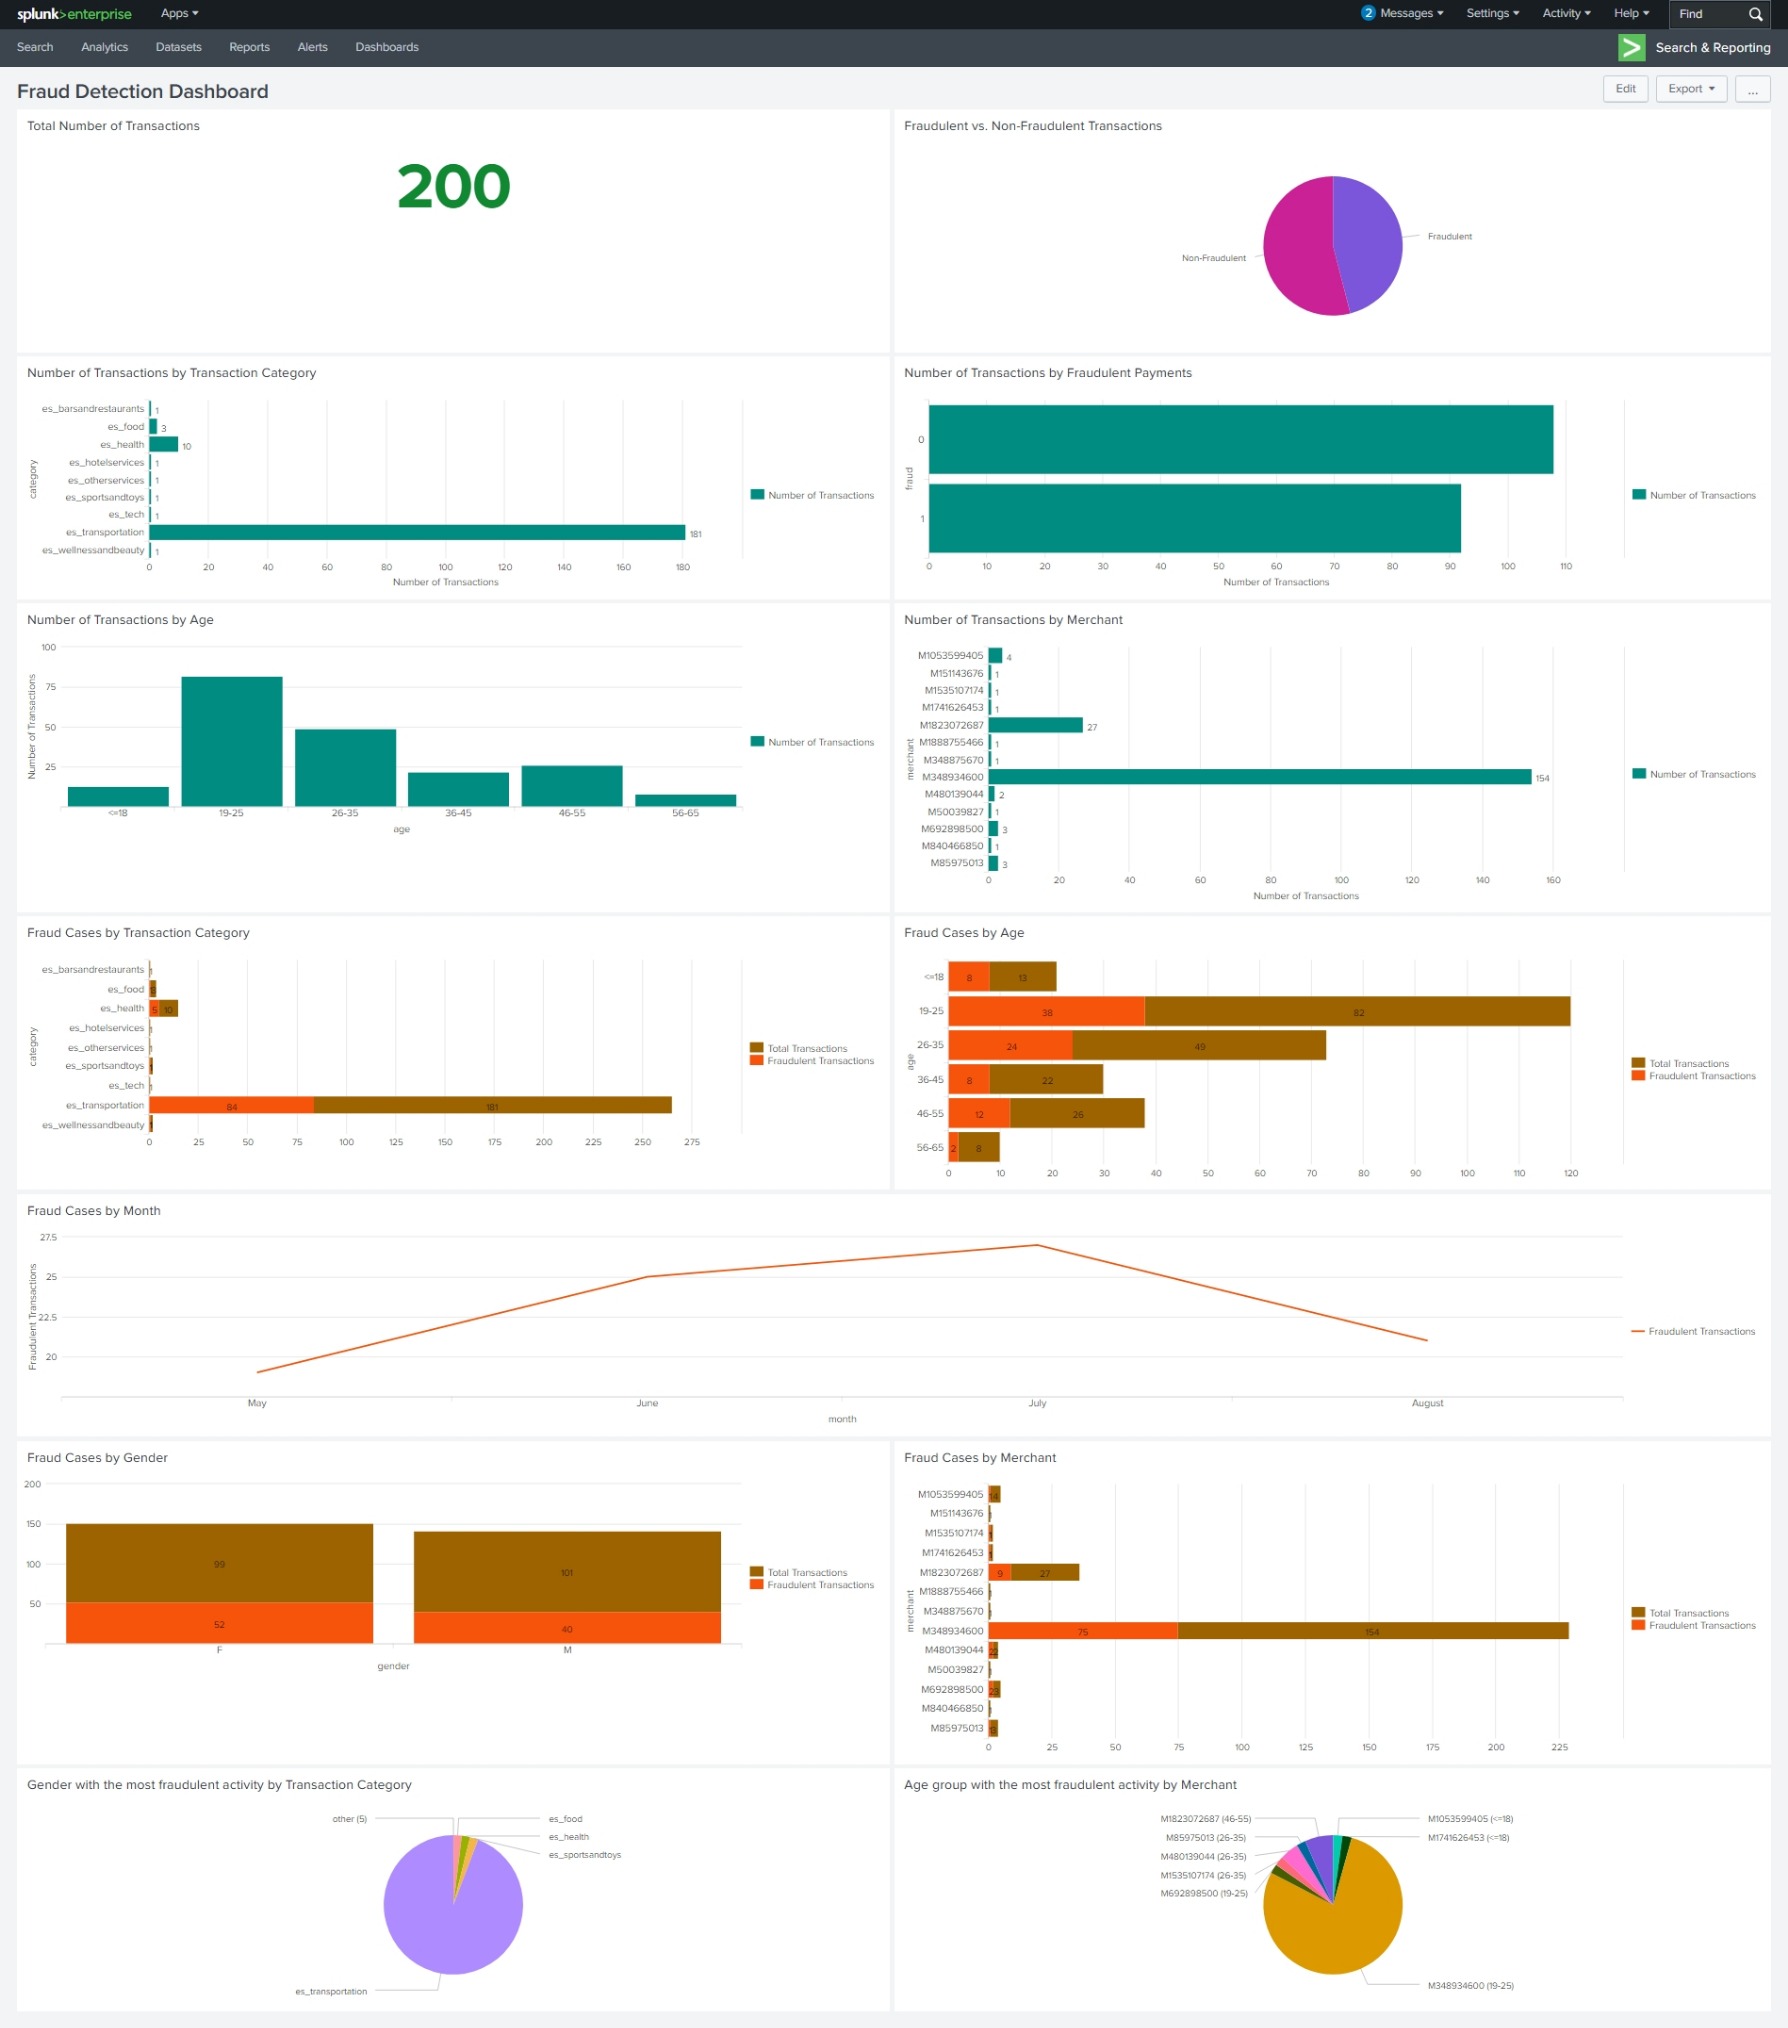
This overall section establishes an analytical baseline, summarizing total transaction volumes and their distribution across transaction categories, age groups, and merchants. These metrics will provide the context needed to identify behavioral patterns, detect anomalies, and compare legitimate activity versus fraudulent transactions in subsequent analyses.
Total Number of Transactions
This visualization shows you the total number of transactions.

Here’s the SPL query used:
1
2
index="main" sourcetype="fraud_detection.csv"
| stats count as "Total Transactions"
Fraudulent vs. Non-Fraudulent Transactions
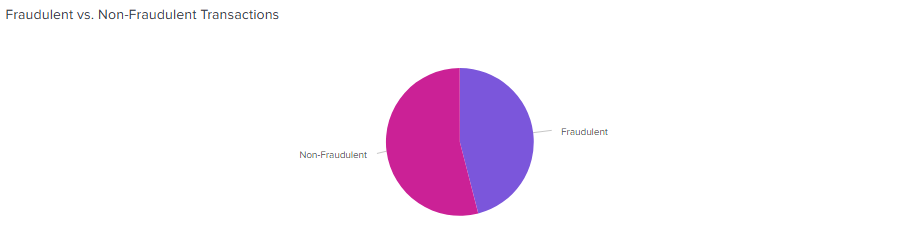
This visualization compares fraudulent vs. non-fraudulent transactions, making it easy to see the overall proportion of fraud. This is often used as one of the first steps in a fraud detection dashboard to give a quick look of fraud levels.
Here’s the SPL query used:
1
2
3
4
index="main" sourcetype="fraud_detection.csv"
| eval status = if(fraud=1, "Fraudulent", "Non-Fraudulent")
| stats count AS Transactions by status
| rename status AS "Transaction Type", Transactions AS "Count"
Number of Transactions by Transaction Category
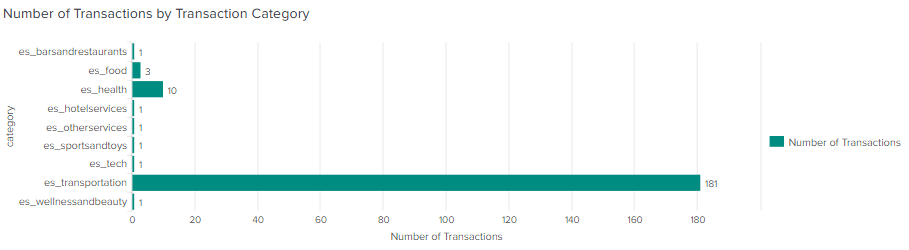
This chart shows you the total number of transactions for each transaction category. It provides a clear view of which types of transactions are most common.
Here’s the SPL query used:
1
2
index="main" sourcetype="fraud_detection.csv"
| stats count as "Number of Transactions" by category
Number of Transactions by Fraudulent Payments
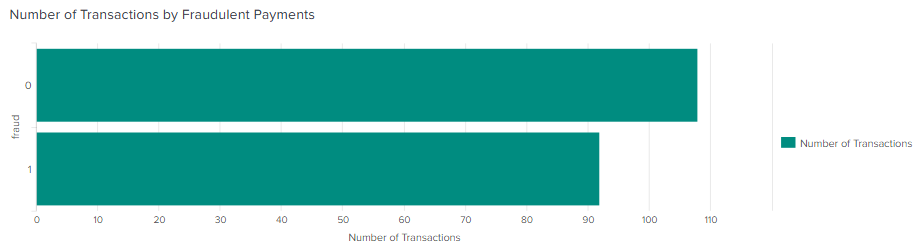
The following chart shows you how many transactions are fraudulent vs. non-fraudulent.
Here’s the SPL query used:
1
2
index="main" sourcetype="fraud_detection.csv"
| stats count as "Number of Transactions" by fraud
Number of Transactions by Age
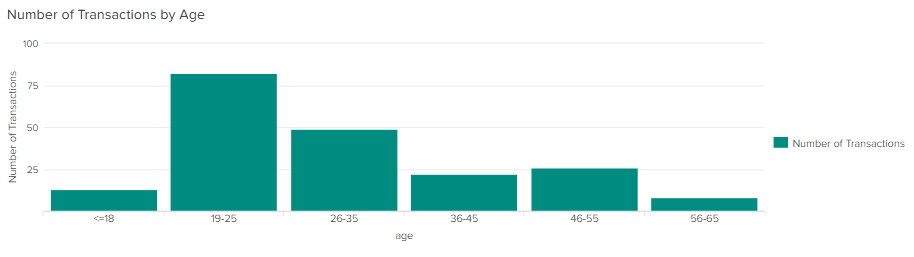
The following visualization shows you the number of transactions distributed across different age groups. You can see which age groups are more active than others, this way you can understand customer behavior by age.
Here’s the SPL query used:
1
2
3
4
5
6
7
8
9
10
11
12
13
14
15
16
17
18
19
20
21
index="main" sourcetype="fraud_detection.csv"
| eval AgeOrder = case(
    age==0, 0,
    age==1, 1,
    age==2, 2,
    age==3, 3,
    age==4, 4,
    age==5, 5
  ),
  AgeRange = case(
    age==0, "<=18",
    age==1, "19-25",
    age==2, "26-35",
    age==3, "36-45",
    age==4, "46-55",
    age==5, "56-65"
  )
| stats count as "Number of Transactions" by AgeRange AgeOrder
| sort AgeOrder
| fields - AgeOrder
| rename AgeRange as age
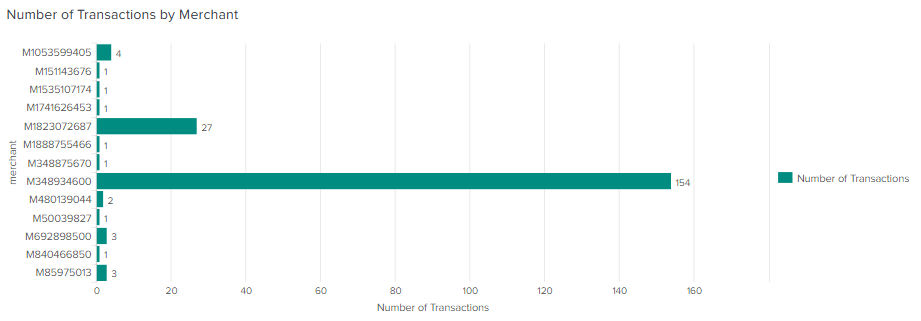
Number of Transactions by Merchant
This visualization shows the number of transactions for each merchant.
Here’s the SPL query used:
1
2
index="main" sourcetype="fraud_detection.csv"
| stats count as "Number of Transactions" by merchant
Fraud Detection Metrics
This section focuses on fraudulent activity distributed across transaction categories, age groups, months, genders, and merchants. Each visualization will help reveal who and where fraud occurs, this way the bank will be able to identify risk patterns, correlations, and areas that may require stronger detection or preventative measures.
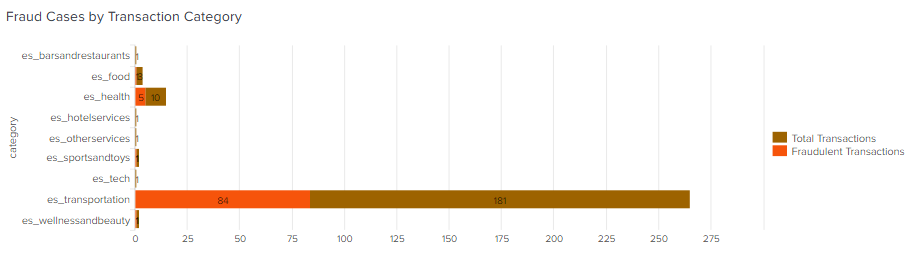
Fraud Cases by Transaction Category
This chart shows you the total number of transactions and the number of fraudulent transactions in each category. It helps identify which transaction categories have higher instances of fraud.
Here’s the SPL query used:
1
2
3
index="main" sourcetype="fraud_detection.csv"
| stats count as "Total Transactions",
        count(eval(fraud=1)) as "Fraudulent Transactions" by category
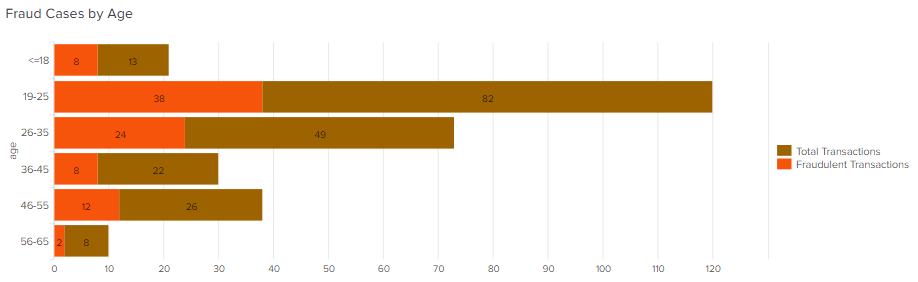
Fraud Cases by Age
This chart shows you the total number of transactions and the number of fraudulent transactions for each age range. It helps identify which age groups have higher fraudulent activity.
Here’s the SPL query used:
1
2
3
4
5
6
7
8
9
10
11
12
13
14
15
16
17
18
19
20
21
index="main" sourcetype="fraud_detection.csv"
| eval AgeOrder = case(
    age==0, 0,
    age==1, 1,
    age==2, 2,
    age==3, 3,
    age==4, 4,
    age==5, 5
  ),
  AgeRange = case(
    age==0, "<=18",
    age==1, "19-25",
    age==2, "26-35",
    age==3, "36-45",
    age==4, "46-55",
    age==5, "56-65"
  )
| stats count as "Total Transactions", count(eval(fraud=1)) AS "Fraudulent Transactions" by AgeRange AgeOrder
| sort AgeOrder
| fields - AgeOrder
| rename AgeRange as age
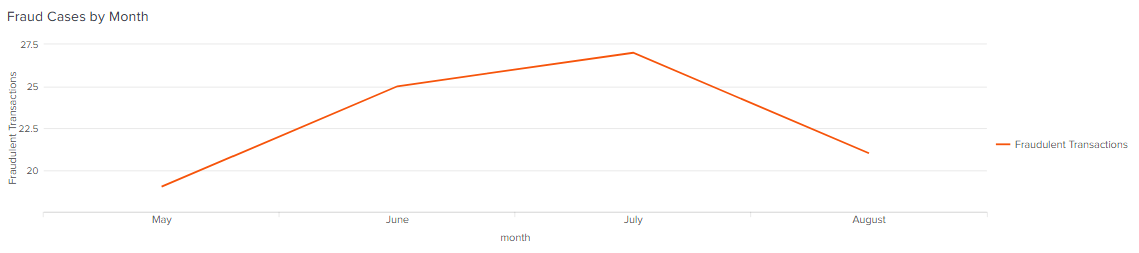
Fraud Cases by Month
The following chart shows you the number of fraudulent transactions per month. It helps the bank to see which months experience higher numbers of fraudulent transactions.
Here’s the SPL query used:
1
2
3
4
5
6
7
8
9
10
11
12
13
14
15
16
index="main" sourcetype="fraud_detection.csv"
| eval month = case(
    step==0, "May",
    step==1, "June",
    step==2, "July",
    step==3, "August"
  )
| stats count(eval(fraud=1)) as "Fraudulent Transactions" by month
| eval month_order = case(
    month=="May",1,
    month=="June",2,
    month=="July",3,
    month=="August",4
 )
| sort month_order
| fields - month_order
Fraud Cases by Gender
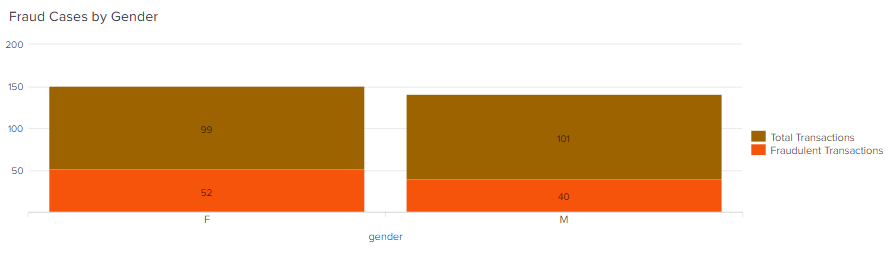
This visualization shows you both the total number of transactions and the number of fraudulent transactions for each gender. It helps the bank understand which genders are associated with higher levels of fraudulent activity.
Here’s the SPL query used:
1
2
index="main" sourcetype="fraud_detection.csv"
| stats count as "Total Transactions", count(eval(fraud=1)) as "Fraudulent Transactions" by gender
Fraud Cases by Merchant
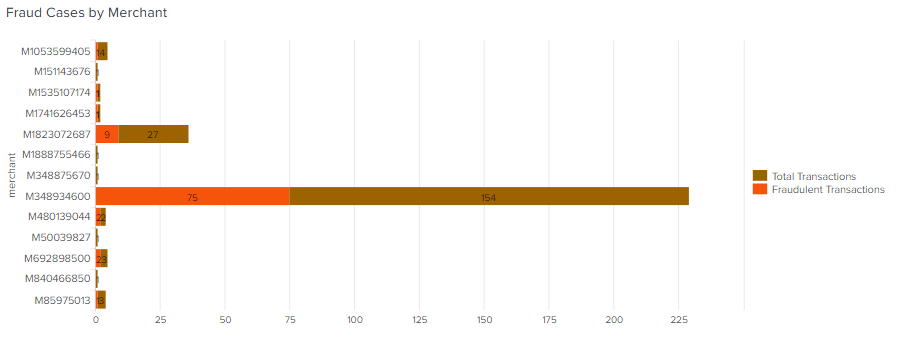
This chart shows you the total number of transactions and the number of fraudulent transactions for each merchant. This helps the bank identify which merchants experience significant fraud activity.
Here’s the SPL query used:
1
2
index="main" sourcetype="fraud_detection.csv"
| stats count as "Total Transactions", count(eval(fraud=1)) AS "Fraudulent Transactions" by merchant
Gender with the most fraudulent activity by Transaction Category
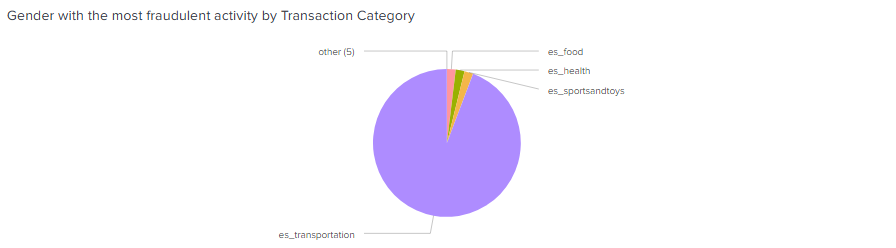
The purpose of this visualization is to identify which gender has the most fraudulent activity within each transaction category.
Here’s the SPL query used:
1
2
index="main" sourcetype="fraud_detection.csv"
| chart count(eval(fraud=1)) as "Fraud Cases" by category, gender
Age group with the most fraudulent activity by Merchant
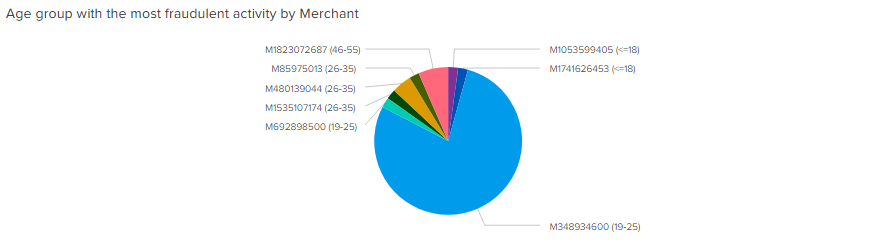
The purpose of this visualization is to identify the age group with the most fraudulent activity for each merchant.
Here’s the SPL query used:
1
2
3
4
5
6
7
8
9
10
11
12
13
14
15
16
17
18
19
20
21
22
23
index="main" sourcetype="fraud_detection.csv"
| eval AgeOrder = case(
    age==0, 0,
    age==1, 1,
    age==2, 2,
    age==3, 3,
    age==4, 4,
    age==5, 5
  ),
  AgeRange = case(
    age==0, "<=18",
    age==1, "19-25",
    age==2, "26-35",
    age==3, "36-45",
    age==4, "46-55",
    age==5, "56-65"
  )
| stats count(eval(fraud=1)) as "Fraudulent Transactions" by merchant AgeRange AgeOrder
| sort 0 merchant - "Fraudulent Transactions"
| dedup merchant
| sort AgeOrder
| eval chartLabel = merchant . " (" . AgeRange . ")"
| fields chartLabel "Fraudulent Transactions"
Final Dashboard
Armed with this dashboard, the bank can now spot unusual trends, recognize fraud patterns, address weak spots, and improve its overall security posture.