HackTheBox - Detecting Attacker Behavior With Splunk Based On Analytics

Traditional log monitoring often generates mountains of data, making it hard to tell normal activity apart from suspicious behavior. That’s where analytics-driven detection comes in. By combining statistical methods with Splunk’s powerful search capabilities, you can identify unusual behavior, like for example processes injecting threads at abnormal rates.
In this write-up, you’ll explore how to use Splunk along with a simple statistical technique to detect attacker behavior. The idea is is simple: first, build a baseline of what “normal” looks like and then flag any deviations from it, this way you can uncover suspicious activity that might point to an intrusion.
Alright, enough talk, let’s dive right in!
Navigate to http://[Target IP]:8000, open the “Search & Reporting” application, and find through an analytics-driven SPL search against all data the source process images that are creating an unusually high number of threads in other processes. Enter the outlier process name as your answer where the number of injected threads is greater than two standard deviations above the average. Answer format: _.exe
This question is asking you to identify the process that is injecting threads into other processes at a rate far above what’s considered “normal”.
From a statistical point of view, this means finding the outlier that’s breaking the baseline of what “normal” looks like. But what exactly is an outlier, and what is considered a “normal” baseline?.
I’ll briefly cover these concepts, however, if you’re already familiar with them, feel free to skip straight to the answer.
Finding What Doesn’t Fit
The general meaning of an outlier is a data point that is unusually far away from most of the other data points in a dataset. For example, suppose you have the following exam scores for a class:
1
70, 72, 75, 80, 82, 85, 95, 20
Can you see something unusual? Yes, you’re right, most students scored between 70 and 95. However, the score 20 is much lower than the rest, that’s basically the outlier: a datapoint that stands out from the “normal” range, a value that simply doesn’t fit the normal pattern.
Alright, finding the outlier is easy in a small dataset, but what about when you’re dealing with a large dataset?. Well, one common way is to use the mean and standard deviation, like this:
- First, find the average of the dataset.
- Next, calculate the standard deviation to see how spread out the data is.
With those two measures in hand, you can interpret the results like this:
- A data point that is 1 standard deviation from the average is considered a normal variation.
- A data point that is 2 standard deviations from the average is often flagged as an outlier.
- A data point that is 3 standard deviations from the average is always treated as an outlier.
To make things clear, suppose you have the following 6 processes with the following thread injection counts:
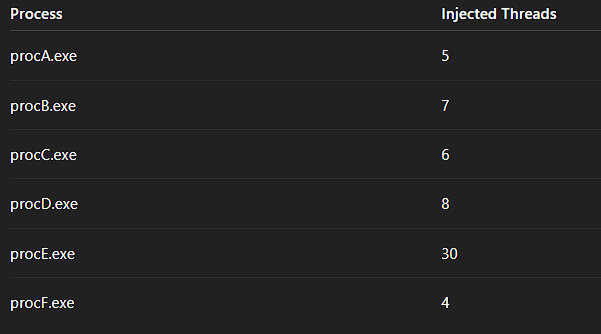
You calculate the average of that dataset:
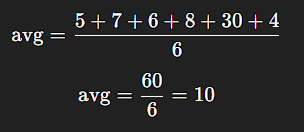
- Average = 10
Now you proceed to calculate the standard deviation:
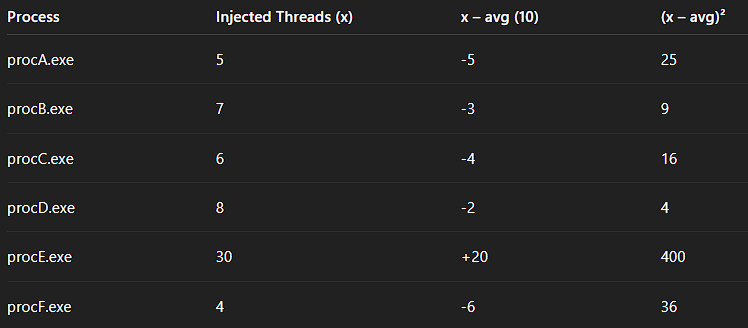
- Sum of squares = 490
- Variance = 490 / 6 = 81.67
- Standard deviation = √81.67 ≈ 9.04
With the average and the standard deviation both in hand you can define what’s “normal” for your dataset. In this example, you’ll use 2 standard deviations for it:
1
Threshold = avg + (2 * stdev)
- Threshold = 10 + (2 * 18.08) = 28.08
Think of avg + (2 * stdev) as the statistical baseline threshold for “normal” behavior in your dataset. Anything up to this level (28.08) is still considered “normal”, basically what most processes are doing. However, anything beyond that threshold would be considered unusually high, and therefore, suspicious and worth investigating.
Now, with the baseline set, you can easily identify which process in your dataset is the outlier:
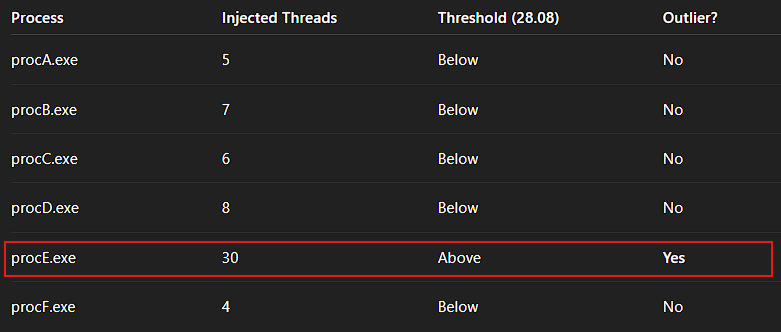
You got it right!, procE.exe is the only outlier because 30 thread injections > 28.08 (baseline).
The Outlier Revealed
To answer this question, check out Sysmon Event ID 8 – CreateRemoteThread events and pay close attention to the SourceImage and TargetImage fields as they’ll tell you who is performing the thread injection and where it’s being injected. Once, you start noticing certain patterns, you can use the following SPL query to spot the outlier:
1
2
3
4
5
index="main" sourcetype="WinEventLog:Sysmon" EventCode=8
| stats count as injectedThreads by SourceImage
| eventstats avg(injectedThreads) as avg stdev(injectedThreads) as stdev
| eval Threshold=avg + (2 * stdev)
| eval isOutlier=if(injectedThreads > Threshold, 1, 0)
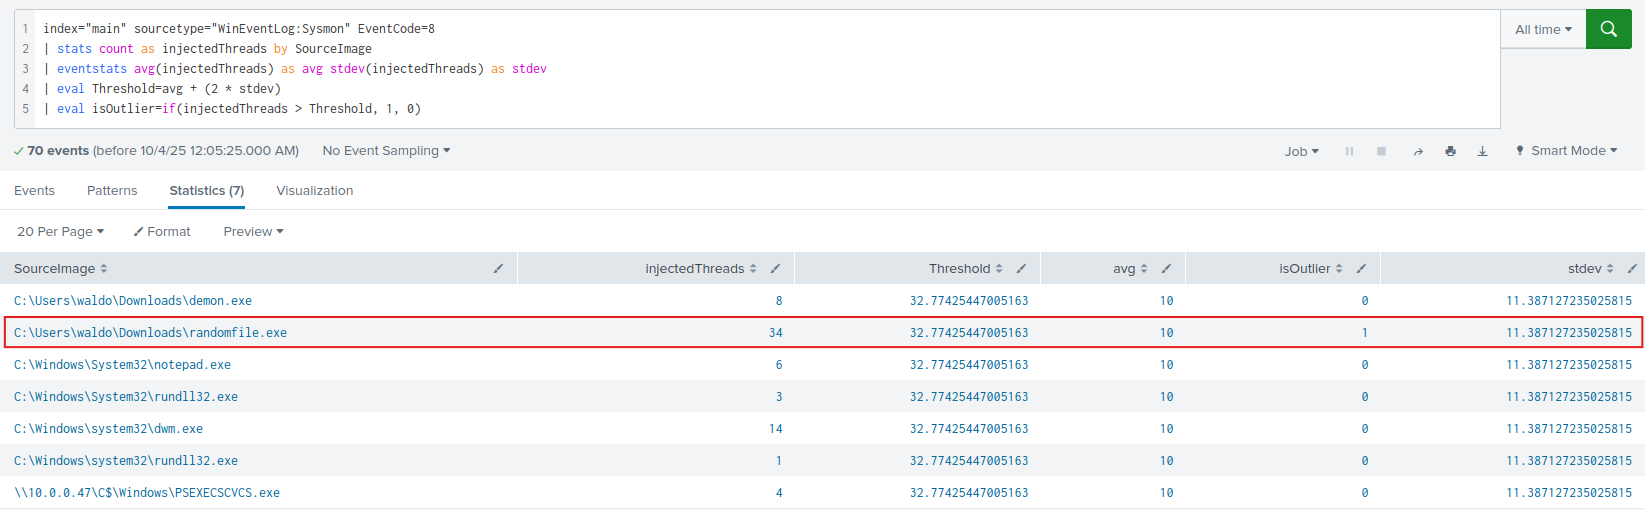
And that’s it. The answer for this question is: randomfile.exe
🚩Challenge completed!. The outlier is caught.
By understanding how outliers work and applying a simple SPL search, you can quickly uncover processes that behave far beyond the normal baseline, proving that statistics + logs = powerful detection. 🚀🔍