HackTheBox - Windows Event Logs and Finding Evil, Skills Assessment Walkthrough

Windows Event Logs are a rich source of information for monitoring system activity and detecting malicious behavior. They can provide you invaluable visibility into what’s happening under the hood of a Windows environment. During this assessments you’ll explore techniques for analyzing Event Logs to identify suspicious activity, uncover hidden threats, and improve your incident response kung-fu skills.
Alright, No time to waste, let’s dive in! 🏊♂️.
By examining the logs located in the C:\Logs\DLLHijack directory, determine the process responsible for executing a DLL hijacking attack. Enter the process name as your answer. Answer format: _.exe
You’re tasked with finding an executable that loads a malicious DLL from an uncommon location that is allowing the attacker to execute arbitrary code on the system.
Do you remember Sysmon’s Event ID 7 - “Image Loaded”?. You’re right, it logs records when an executable loads a DLL into memory and in the context of DLL Hijacking, Event ID 7 can help you reveal processes loading unexpected or suspicious DLLs, specially from non-standard directories.
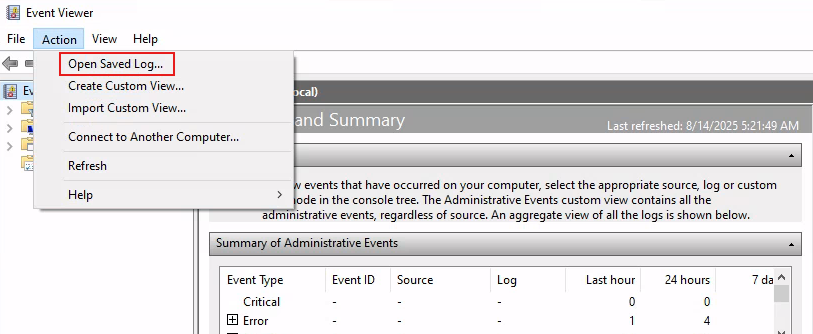
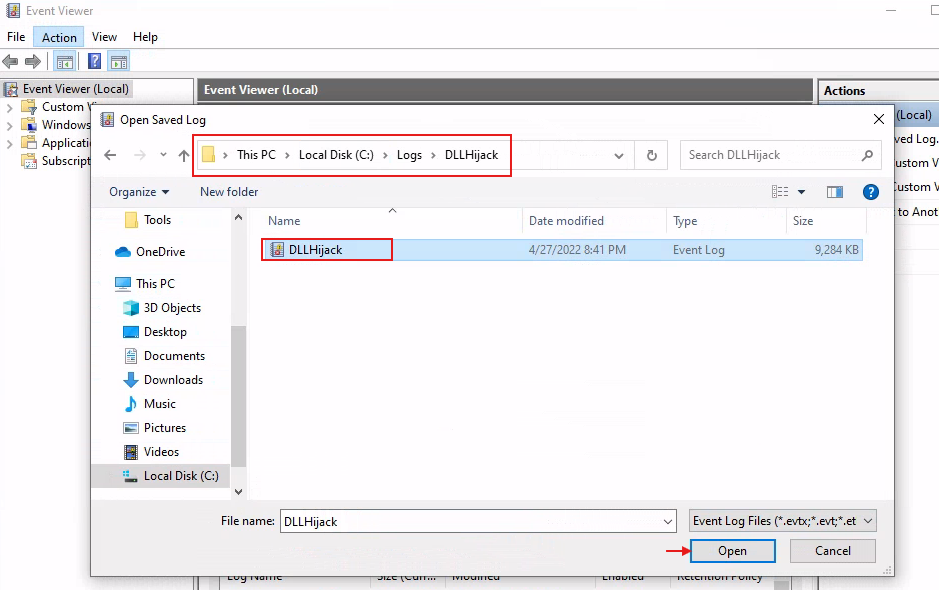
Ok, let’s begin. First, open the log file in Windows Event Viewer as follows:
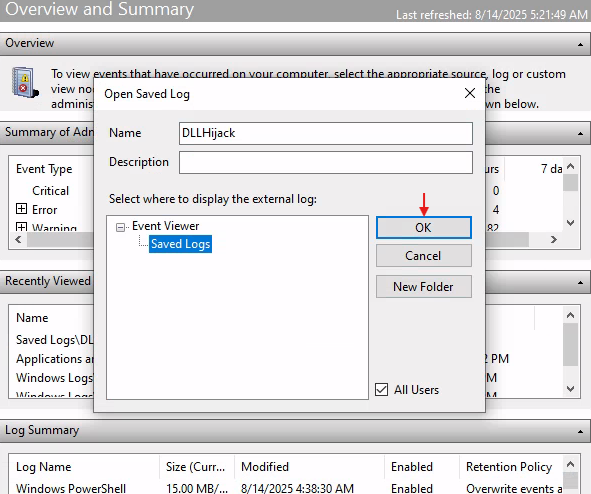
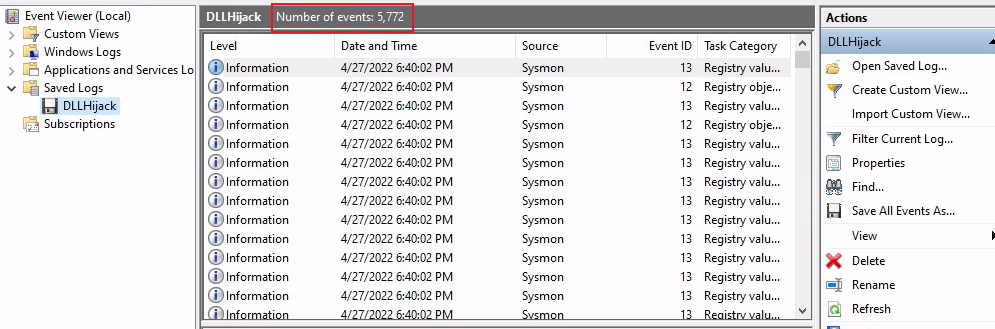
Press OK and you’ll see around 5,722 log event entries loaded:
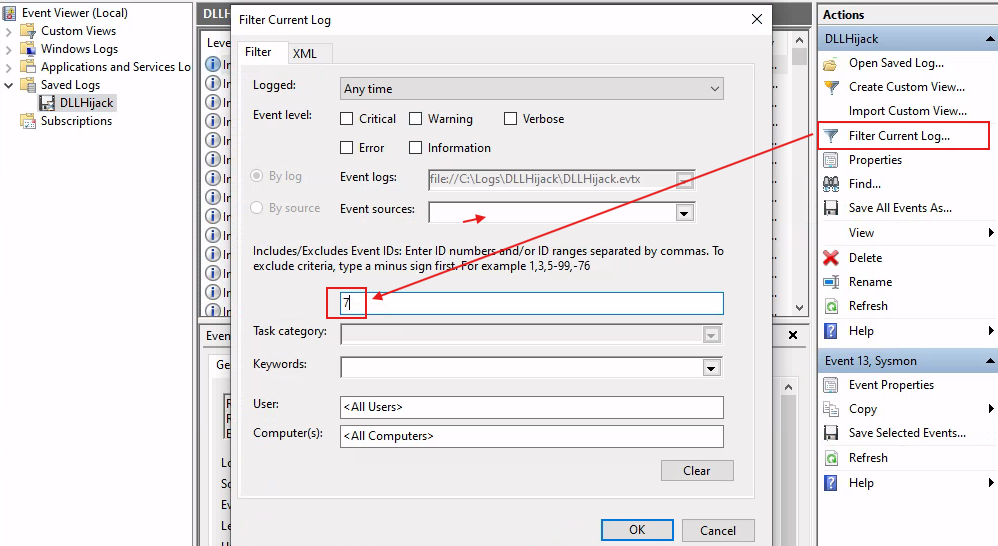
Next, filter the log to display only entries with Event ID 7:
You log is now narrowed down to 1,196 Event ID 7 entries:
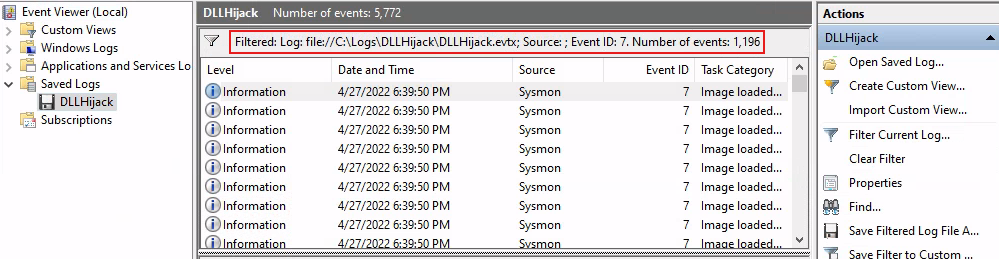
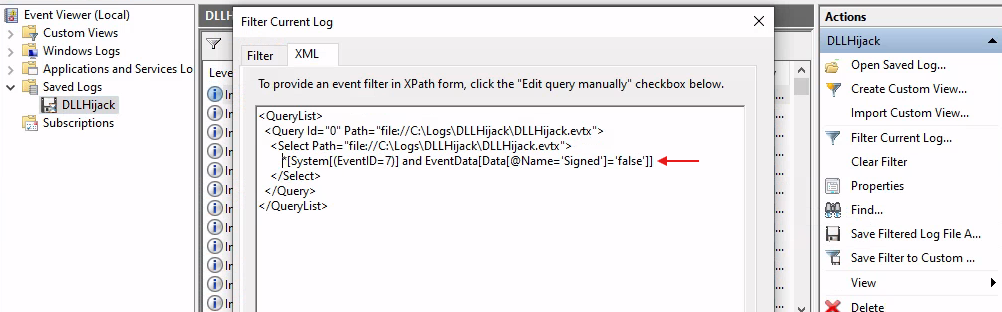
Much better. However, looking through more than 1,000 thousand log entries is still cumbersome and tedious. Let’s narrow these log entries down even more. As you already know, forged or malicious DLLs are often unsigned binaries, meaning they lack a valid digital signature to verify their publisher and integrity. To focus on these, you’ll create a custom XPath XML query as follows:
1
2
3
4
5
6
7
<QueryList>
	<Query Id="0" Path="file://C:\Logs\DLLHijack\DLLHijack.evtx">
		<Select Path="file://C:\Logs\DLLHijack\DLLHijack.evtx">
			*[System[(EventID=7)] and EventData[Data[@Name='Signed']='false']]
		</Select>
	</Query>
</QueryList>
Press OK, and voilà, a more manageable set of entries, right?:
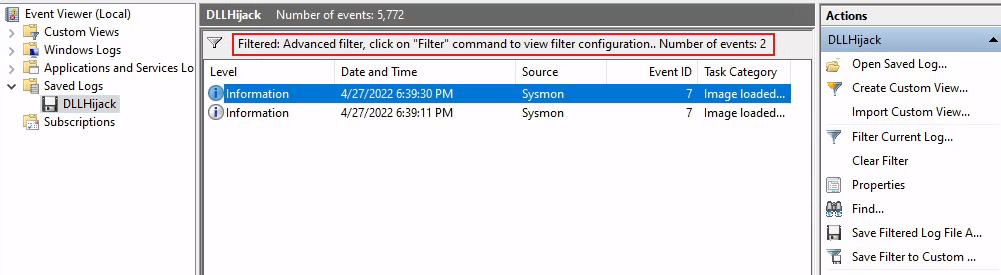
Now all you have to do is to inspect these two log entries. Let’s check the first one:
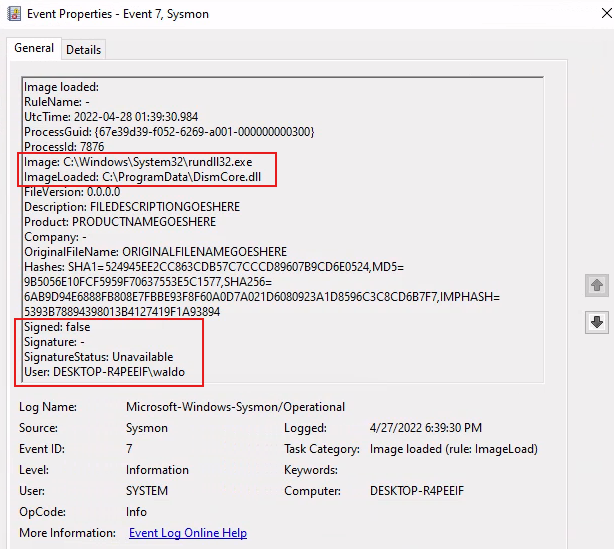
Mmmmm 🤔, kinda suspicious, but not the one you’re looking for. How about the second one?:
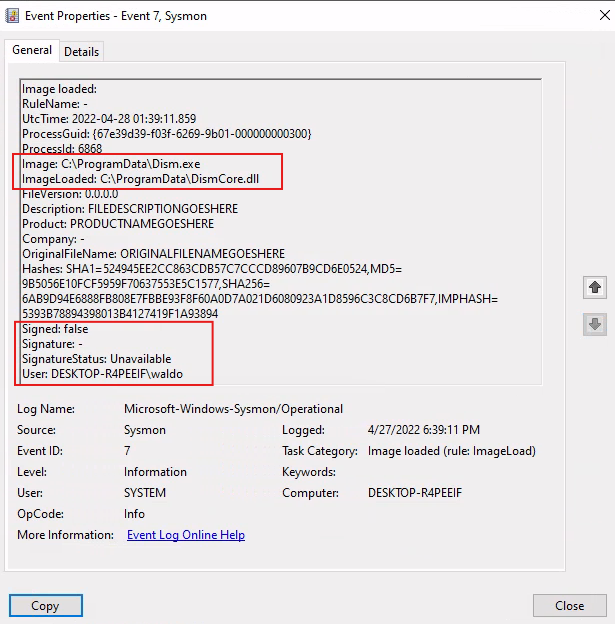
All right, a bit of context:
Dism.exestands for Deployment Imaging Servicing and Management, a command-line tool in Windows used to repair Windows images, including installing, uninstalling, configuring, and updating features and packages.Dism.dllon the other hand is its supporting library that provides the underlying functions DISM uses to perform those image management operations.
So, for both files their legitimate Windows locations is typically C:\Windows\System32\. If you find them outside that directory (especially in user-writable paths), it would be suspicious and could indicate tampering or DLL hijacking.
In this sense, the answer to this question is obvious: Dism.exe
By examining the logs located in the C:\Logs\PowershellExec directory, determine the process that executed unmanaged PowerShell code. Enter the process name as your answer. Answer format: _.exe
As you previously learned, seeing clr.dll, and clrjit.dll should immediately catch your attention as these two DLLs are part of the .NET runtime and are used to execute C# bytecode. If they show up in processes that normally wouldn’t need them, it could be a sign of an unmanaged PowerShell Injection.
With this in mind, you must identify suspicious executables that load either the clr.dll or clrjit.dll libraries.
First, open the C:\Logs\PowershellExec\PowershellExec.evtx log file in Event Viewer, just as you did in the previous exercise, and filter it by Event ID 7 (remember the one that record entries when processes load their libraries). As you can see, there are about 3,694 log entries:
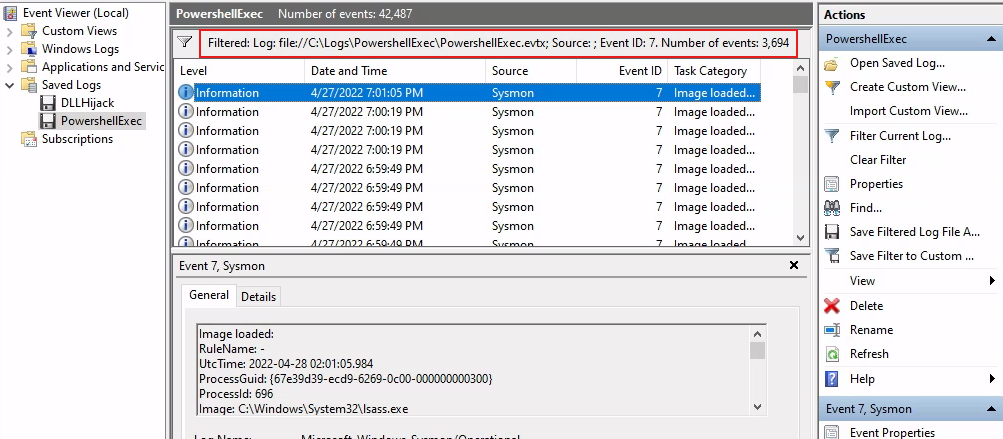
Click on Find... and search for either clr.dll or clrjit.dll:
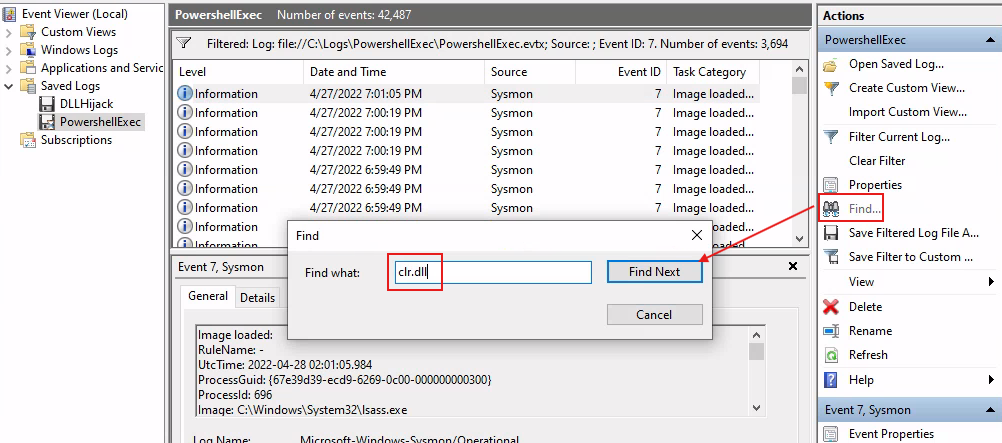
Click on the first match and pay attention to the result:
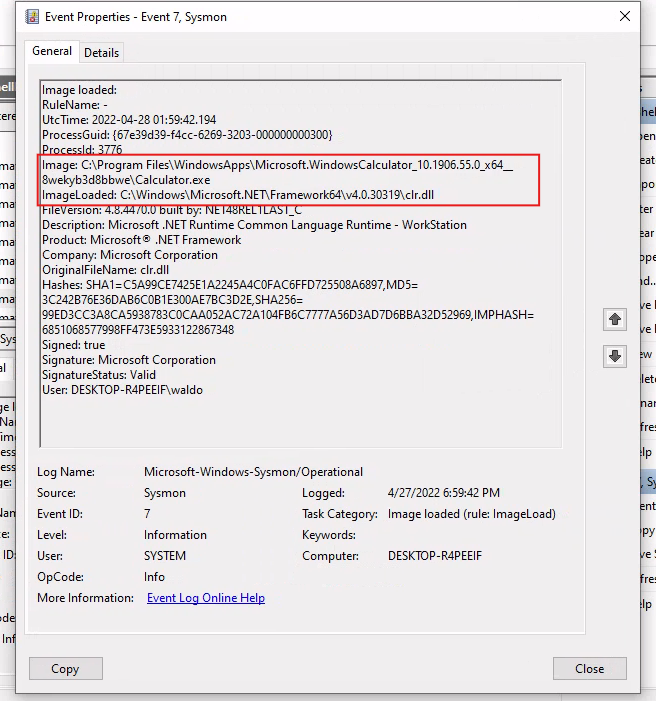
You’ll see a binary called Calculator.exe. This application is a legit binary on modern versions of Windows. Here’s a breakdown of its path:
C:\Program Files\WindowsApps: It’s the default and protected system directory where Microsoft Store apps are installed.Microsoft.WindowsCalculator_...: It’s the package folder for the Windows Calculator app. The string includes the publisher (Microsoft.WindowsCalculator), followed by the version number (10.1906.55.0), and finally the architecture (x64)._8wekyb3d8bbwe: This is a unique publisher ID for Microsoft. Every app publisher has a unique identifier in the UWP ecosystem.
However, even though this is a legit UWP app, as far as I know it shouldn’t normally have any reason to load clr.dll, or even clrjit.dll:
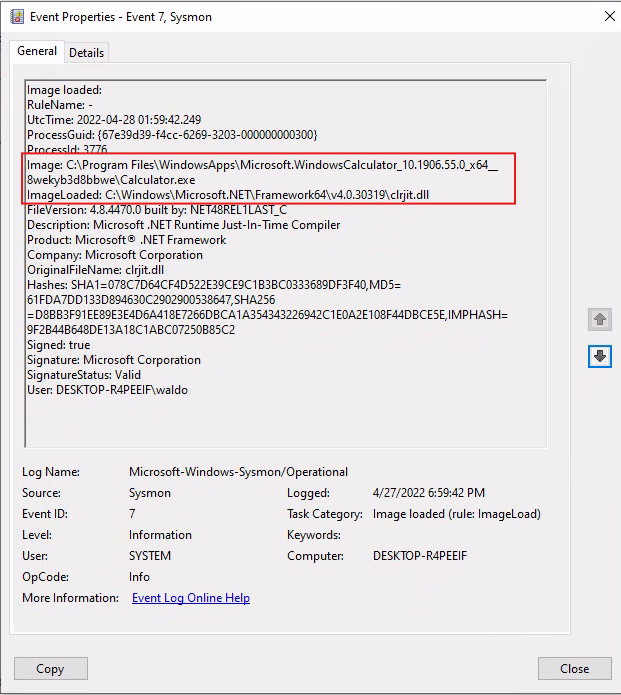
So, based on this analysis, you can conclude that this legit binary is being abused to execute unmanaged PowerShell Code.
Therefore, the answer for this question is: Calculator.exe
By examining the logs located in the C:\Logs\PowershellExec directory, determine the process that injected into the process that executed unmanaged PowerShell code. Enter the process name as your answer. Answer format: _.exe
This question is linked to the previous one. Now that you’ve identified the binary executing unmanaged PowerShell code, your next task is determine the binary that’s injecting code into Calculator.exe.
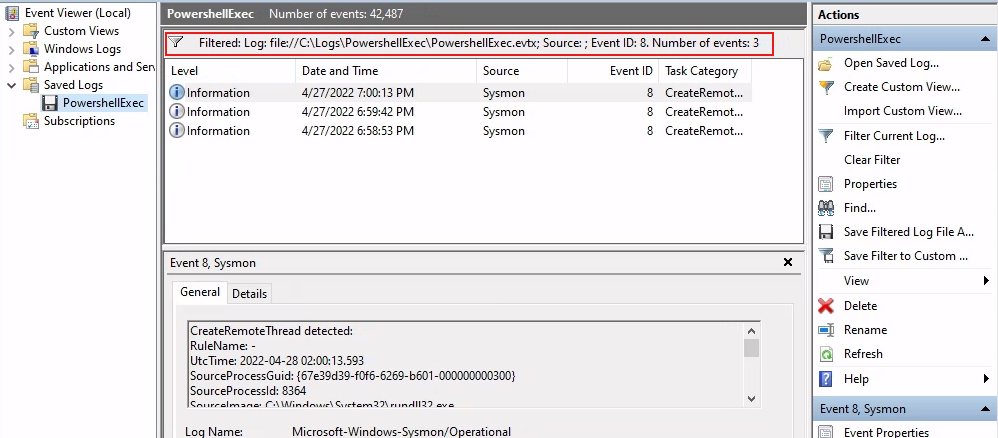
This scenario is a classic example of Living-off-the-Land Binary (LOLBin) abuse, where attackers exploit legitimate system tools to execute malicious payloads. In this case, none of the Sysmon’s Event IDs you’ve learned so far will help you discover this type of activity. However, if you review the full list of Sysmon’s Event IDs, you’ll likely notice an event type that really stands out and will help you to answer this question, I’m talking about the Event ID 8 - “CreateRemoteThread”.
An Event ID 8 - “CreateRemoteThread” is generated when a process creates a new thread inside another process’s memory space using the Windows API CreateRemoteThread(or equivalent). This makes it a valuable indicator for detecting code injection techniques or process injection attacks.
So, whenever you see an Event ID 8, it’s very likely that malware is injecting code into another process. However, this isn’t always the case, false positives can also occur, since legitimate software can also use the Windows API CreateRemoteThread, while rare, this is entirely possible.
With this in mind, open the C:\Logs\PowershellExec\PowershellExec.evtx log file in Event Viewer and filter by Event ID 8:
Next, search for the compromise binary, in your case Calculator.exe:
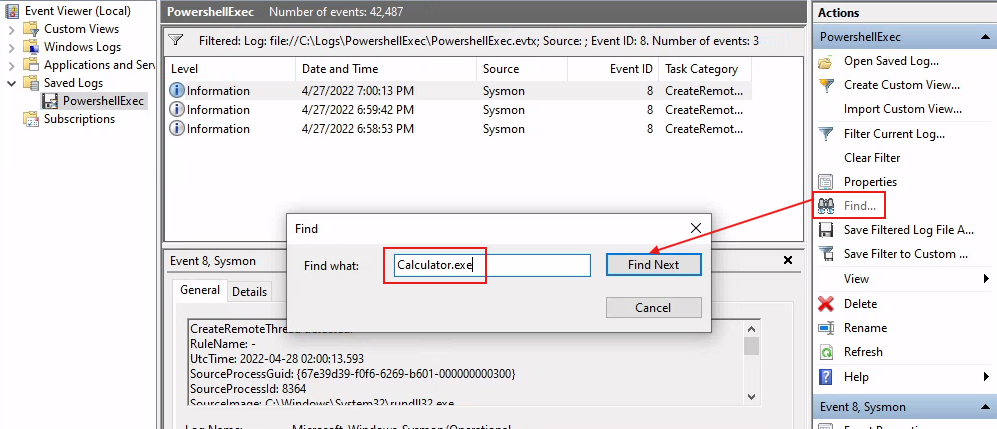
Pick the entry log that matched you search:
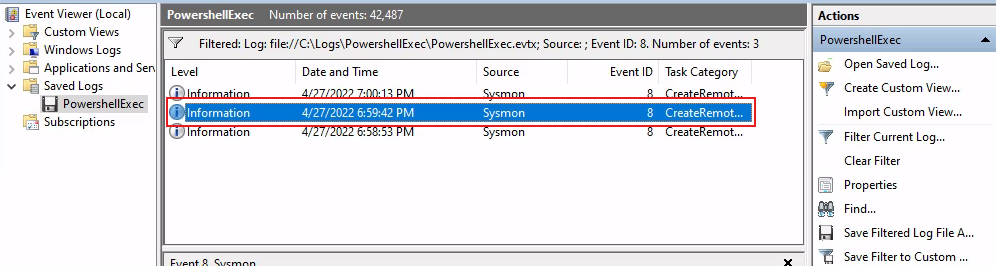
And pay attention to the result:
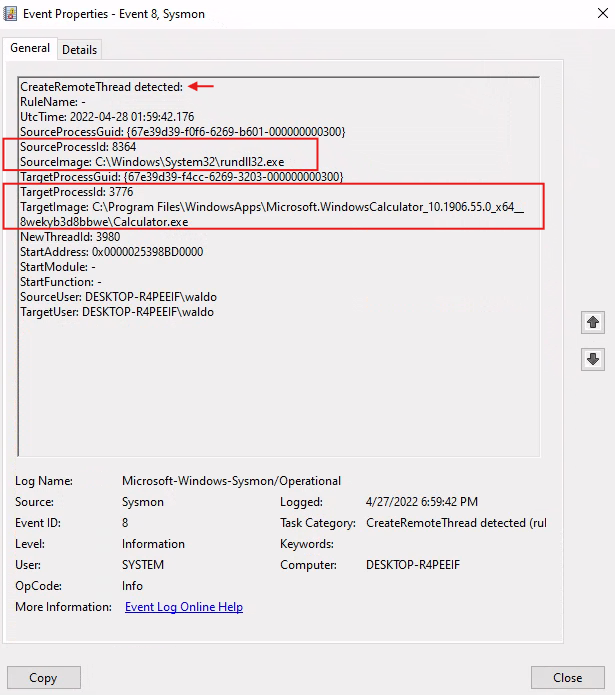
The SourceImage field identifies the process performing the injection, while the TargetImage indicates the executable being injected into. In this case, rundll32.exe injected code into Calculator.exe via the Windows API CreateRemoteThread. This strongly suggests a malicious activity, with rundll32.exe acting as the injector and Calculator.exe being abused as the host for malicious execution.
So, the answer for this question is: rundll32.exe
By examining the logs located in the C:\Logs\Dump directory, determine the process that performed an LSASS dump. Enter the process name as your answer. Answer format: _.exe
Here you’re presented with an LSASS dump attack scenario. Your job is to identify evidence of LSASS dumps in Sysmon logs.
Look, what makes LSASS valuable to attackers is that it holds sensitive authentication material in memory while the system is running, things like: usernames, cleartext passwords (in some cases), NTLM password hashes, Kerberos tickets, cached domain credentials, and so on. So, by dumping the memory of the lsass.exe process, an attacker can extract this information and later parsing it to extract those secrets.
The most reliable way to spot an LSASS dumping attack is via Sysmon’s Event ID 10 - ProcessAccess. Security analysts use this event to detect tools like Procdump or Mimikatz being used against LSASS.
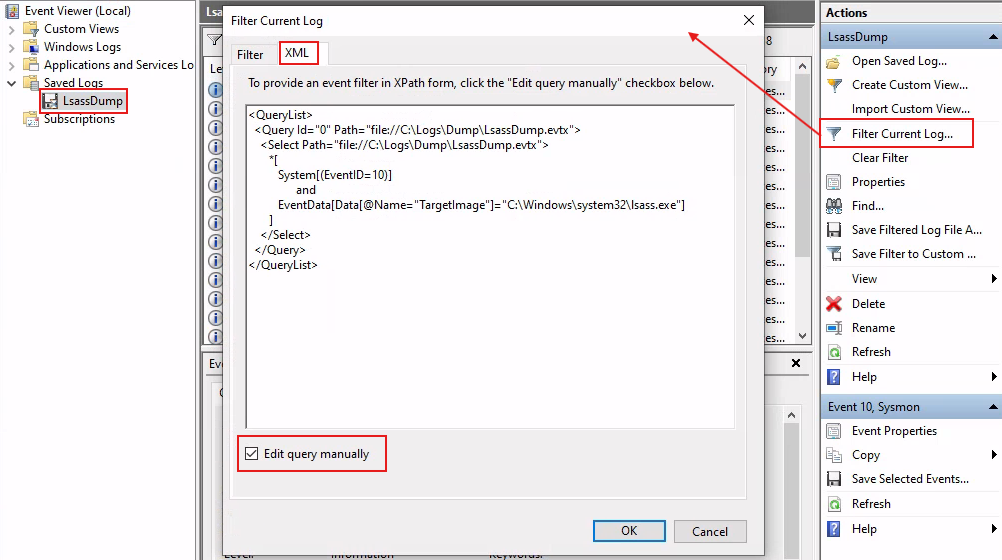
Alright, let’s get to it. Open C:\Logs\Dump\LsassDump.evtx in Event Viewer and write the following XML XPath query:
1
2
3
4
5
6
7
8
9
10
11
<QueryList>
	<Query Id="0" Path="file://C:\Logs\Dump\LsassDump.evtx">
		<Select Path="file://C:\Logs\Dump\LsassDump.evtx">
			*[
			System[(EventID=10)]
				and
			EventData[Data[@Name="TargetImage"]="C:\Windows\system32\lsass.exe"]
			]
		</Select>
	</Query>
</QueryList>
Click OK, and the filter will be applied to your log.
You see, when a malicious process tries to dump LSASS, it must first open a handle to lsass.exe with elevated privileges. Since legitimate processes rarely need to do this, an Event ID 10 targeting lsass.exe is a strong indicator of a potential credential dumping.
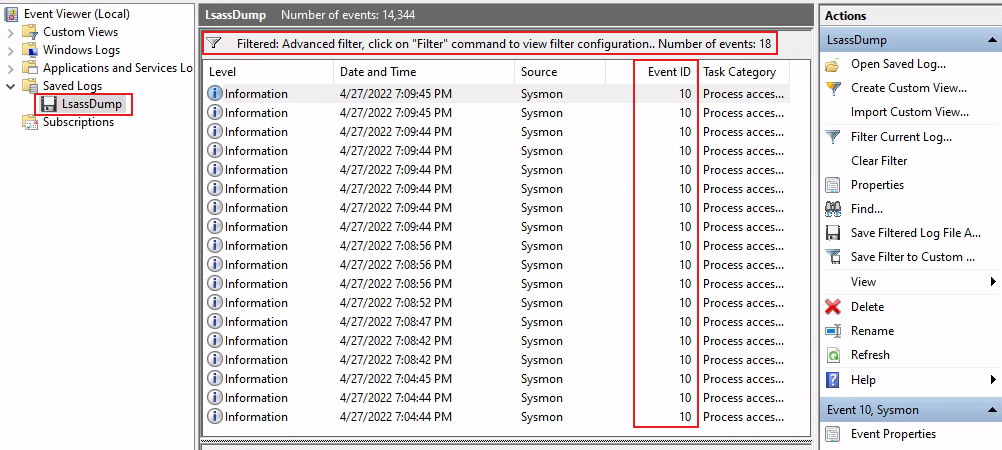
Now inspect each entry, one at the time, and see if you can spot anything suspicious. Alright this one looks questionable:
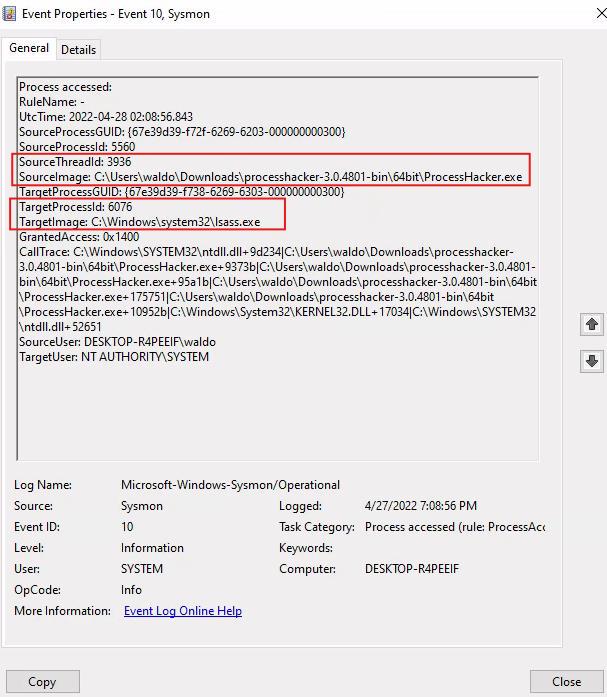
Pay attention to the SourceImage and TargetImage fields. As you can see, ProcessHacker.exe (a legitimate tool often abused by attackers) is being used to open a handle to lsass.exe. This behavior strongly suggests a potential LSASS dump attack in progress.
Therefore, the answer for this question is: ProcessHacker.exe
By examining the logs located in the C:\Logs\Dump directory, determine if an ill-intended login took place after the LSASS dump. Answer format: Yes or No
This question is related to the previous one. Now that you’ve confirmed the LSASS dump attack, your next task is to determine if a malicious login took place.
To answer that question you first need to verify if the LSASS dump attack actually had success. But how can you do this?. In Sysmon Event ID 10 - “ProcessAccess” entry logs, security analysts use the GrantedAccess field to detect suspicious or malicious activity, especially when a non-standard process attempts to access the memory of sensitive process like lsass.exe.
You see, the GrantedAccess field contains the permissions the Windows operating system has granted to a source process to interact with a target process. These permissions can go from querying information (0x0400), to reading memory (0x0010), or even taking full control (0x1FFFFF) of the target process.
When investigating LSASS dumps, focus on Event ID 10 logs where:
TargetImage=lsass.exe.GrantedAccesis0x1FFFFF,0x1F0FFF,0x1010or0x1438.SourceImage: Check the value of this field. Investigate the process requesting access, identify if it’s a known malicious tool, a signed but abused utility, or a legitimate process that could lead you to a false positive.
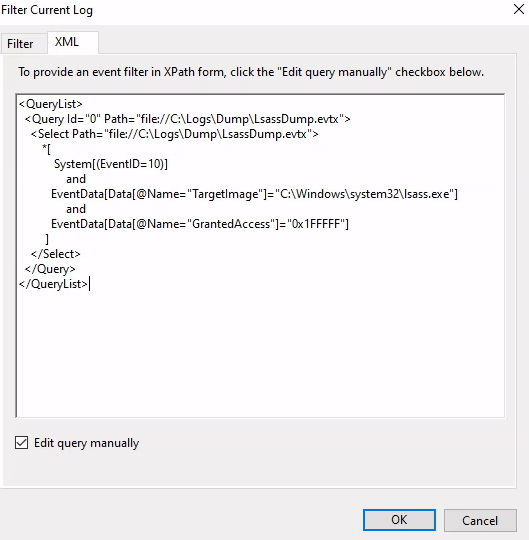
Alright, long story short. Open C:\Logs\Dump\LsassDump.evtx in Event Viewer and write the following XML XPath query:
1
2
3
4
5
6
7
8
9
10
11
12
13
<QueryList>
	<Query Id="0" Path="file://C:\Logs\Dump\LsassDump.evtx">
		<Select Path="file://C:\Logs\Dump\LsassDump.evtx">
			*[
			System[(EventID=10)]
				and
			EventData[Data[@Name="TargetImage"]="C:\Windows\system32\lsass.exe"]
				and
			EventData[Data[@Name="GrantedAccess"]="0x1FFFFF"]
			]
		</Select>
	</Query>
</QueryList>
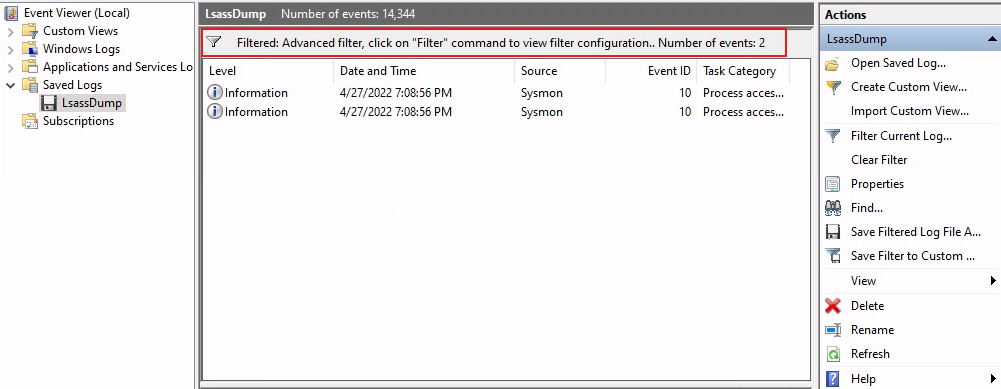
You’ll get all log entries where a source process tried to get full control (0x1FFFFF) over lsass.exe:
Pick an entry log and pay attention to the result:
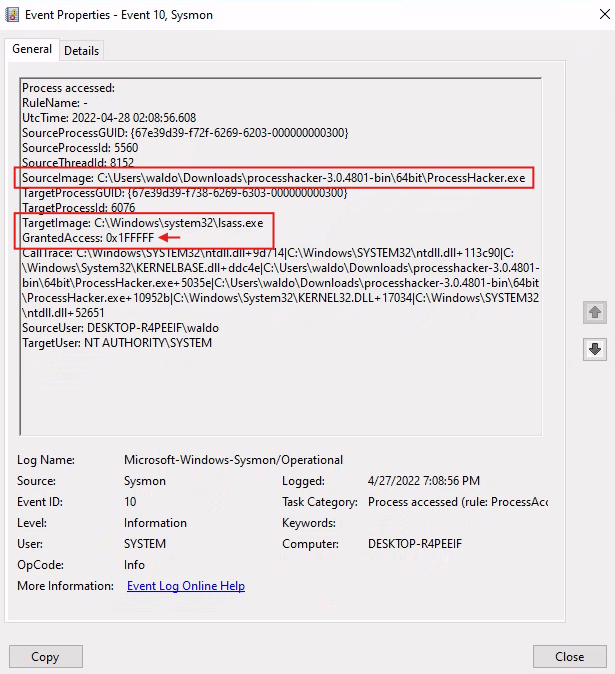
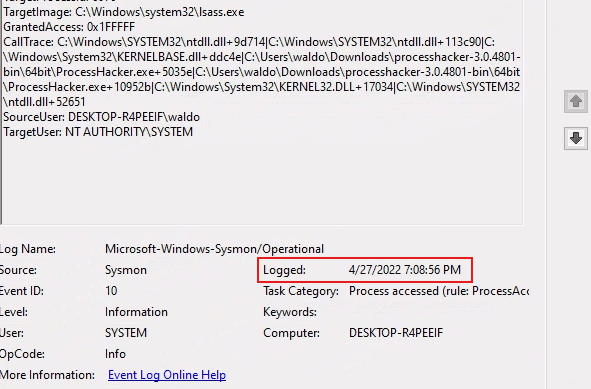
As you can see, the Windows OS granted ProcessHacker.exe full access (0x1FFFFF) to lsass.exe, a strong indicator that credential dumping likely succeded. At this point, there is a high probability that the attacker now possesses the credentials needed to access your environment. With this in mind your next task is to investigate any suspicious logons that occurred after this dump.
First, take note of the date and time when this incident occurred:
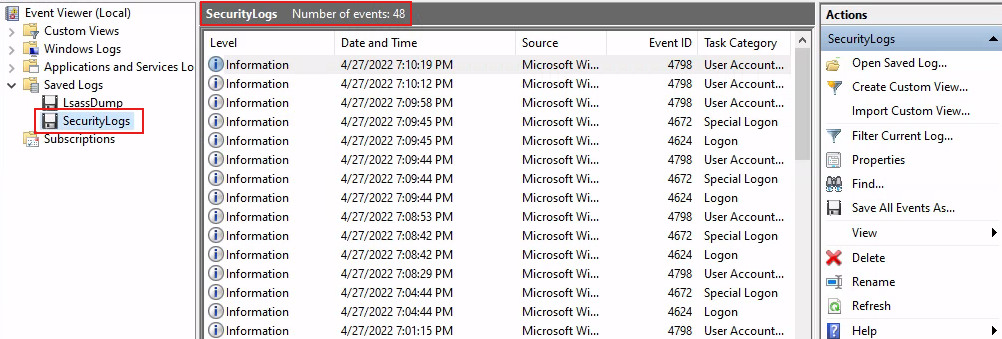
In your Event Viewer open the provided C:\Logs\Dump\SecurityLogs.evtx log file:
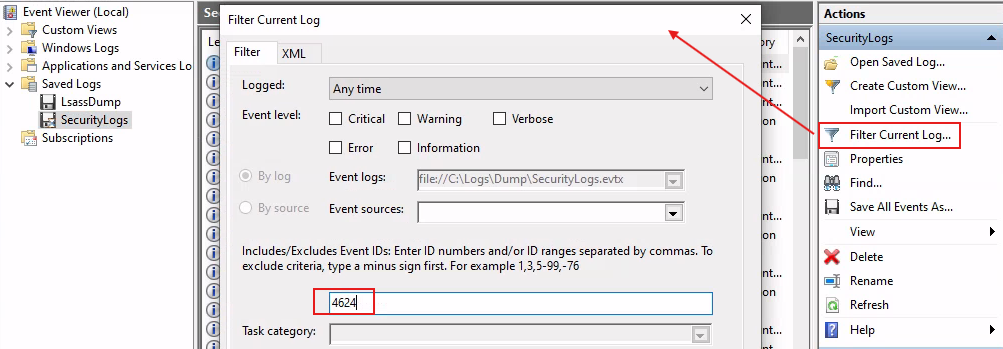
Search for Event ID 4624 (Successful logon):
And look for events after 4/27/2022 7:08:56 PM:
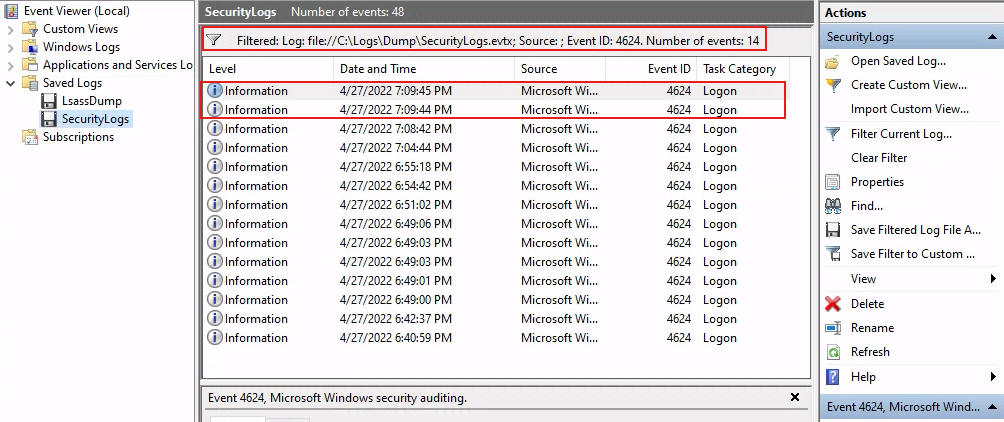
When you inspect any of those log events, you’ll notice they’re just non-interactive logins:
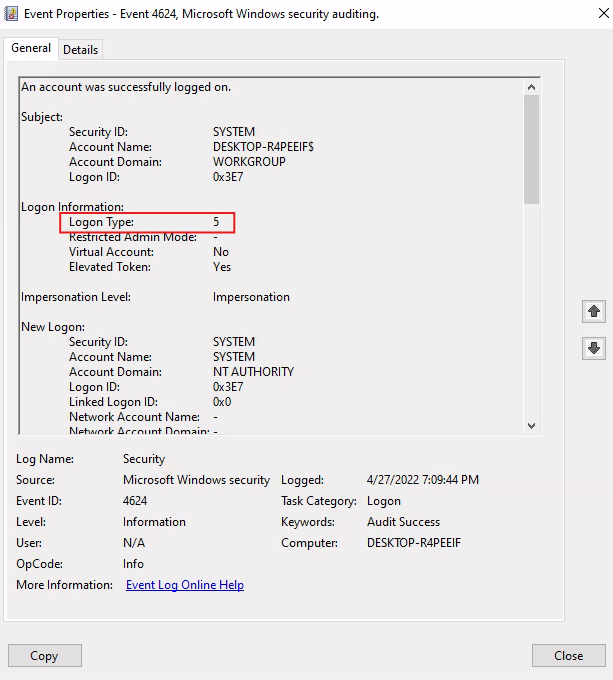
Remember, Logon Type 5 in the Security logs represents a service logon. Therefore, based off of this analysis, no interactive logins occurred after the LSASS dump.
The answer for this question is: No
By examining the logs located in the C:\Logs\StrangePPID directory, determine a process that was used to temporarily execute code based on a strange parent-child relationship. Enter the process name as your answer. Answer format: _.exe
My first thought in regards to this challenge was that it might be a Parent PID Spoofing attack scenario. However, what you’re actually seeing here is a case of temporary code execution triggered by an unusual parent-child relationship that doesn’t align with normal process behavior.
What can you do to spot this kind of activity?. Well, you can use Sysmon’s Event ID 1 - “Process Create” to look for suspicious parent-child relationships. When investigating this type of activity, pay special attention to the ProcessId, ParentProcessId, ProcessName, ParentProcessName, and CommandLine fields.
Alright, time to jump in!. First open the provided C:\Logs\StrangePPID\StrangePPID.evtx log file in Event Viewer and filter by Event ID 1:
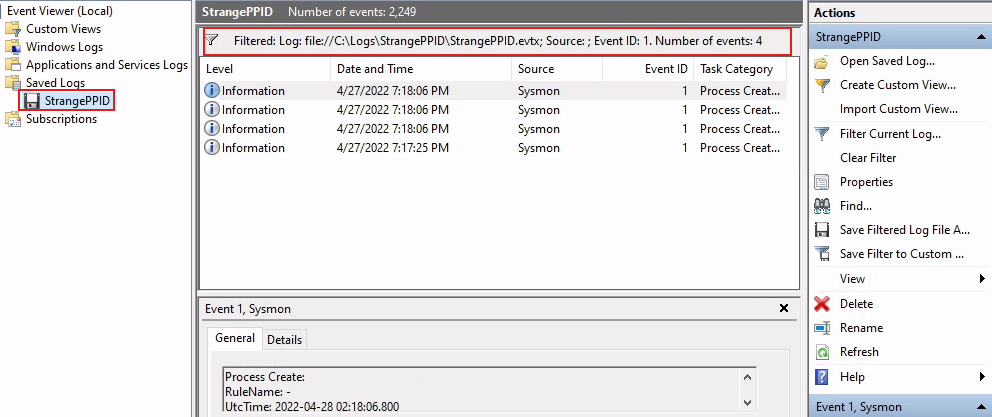
Now, simply inspect each entry log, one at the time and see if you can spot an unusual relationship between parent-child processes. Here’s one I think looks suspicious:
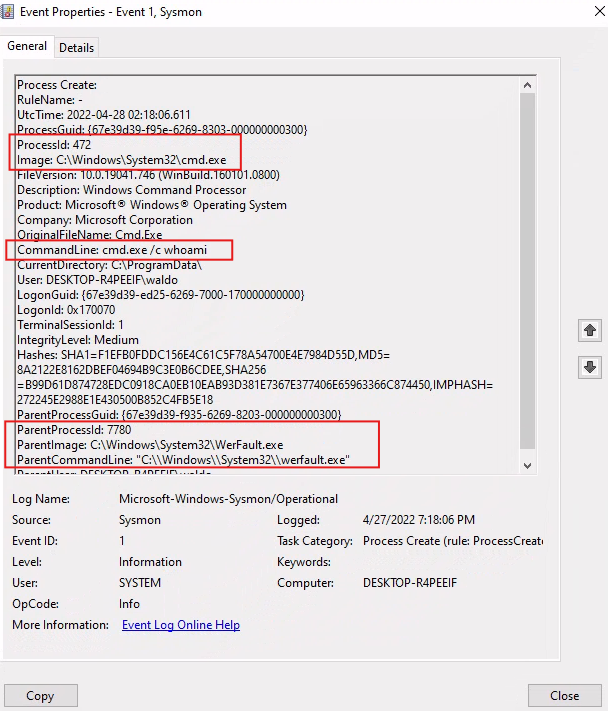
If you reconstruct the full parent-child execution chain, you’d get something like this:
1
werfault.exe → cmd.exe → cmd.exe /c whoami → exits
Let’s break it down:
werfault.exe: This is the Windows Error Reporting process. Normally, it handles crash reporting, not the launch of interactive shells. However, here it is being abused to launch a one-off shell for executing a specific command.cmd.exe /c whoami: This runs thewhoamicommand viacmd.exeusing the/cflag, which executes the command once and then terminates the shell immediately.
Based on this analysis, you can say that the answer for this question is: werfault.exe
I hope this article has given you some useful insights into Windows Event Logs and how to spot suspicious activity. Recognizing unusual patterns and understanding what “normal” really looks like is hard, but with a bit of practice you’ll start spotting anomalies more easily and gain confidence in identifying potential threats. Keep exploring, and let your curiosity guide your threat-hunting journey 😉.