HackTheBox - Introduction to Splunk and SPL

Splunk is a powerful platform used for searching, monitoring, and analyzing machine-generated data. One of the coolest parts of Splunk is its Searching Processing Language (SPL), that allows you to query information from raw log data. With it you can detect anomalies, identify security threats, or simply understand system behavior.
During these challenges, you’ll craft and run SPL queries against event logs to filter results and uncover patterns of account activity. Without further ado, let’s just jump right in!.
Navigate to http://[Target IP]:8000, open the “Search & Reporting” application, and find through an SPL search against all data the account name with the highest amount of Kerberos authentication ticket requests. Enter it as your answer
What makes Kerberos secure is that it doesn’t send your password over the network. Instead, it uses a ticket-based system to prove who you are. You see, when you login in to a Windows domain, your workstation requests a TGT (Ticket Granting Ticket) directly from the KDC (Key Distribution Center), which is a service running on a domain controller. This action is logged as an Event ID 4768 in the domain controller’s Security log.
Use the following SPL query to find the account with the highest number of Kerberos ticket requests:
1
2
3
index="main" sourcetype="WinEventLog:Security" EventCode=4768
| stats count by Account_Name
| sort -count
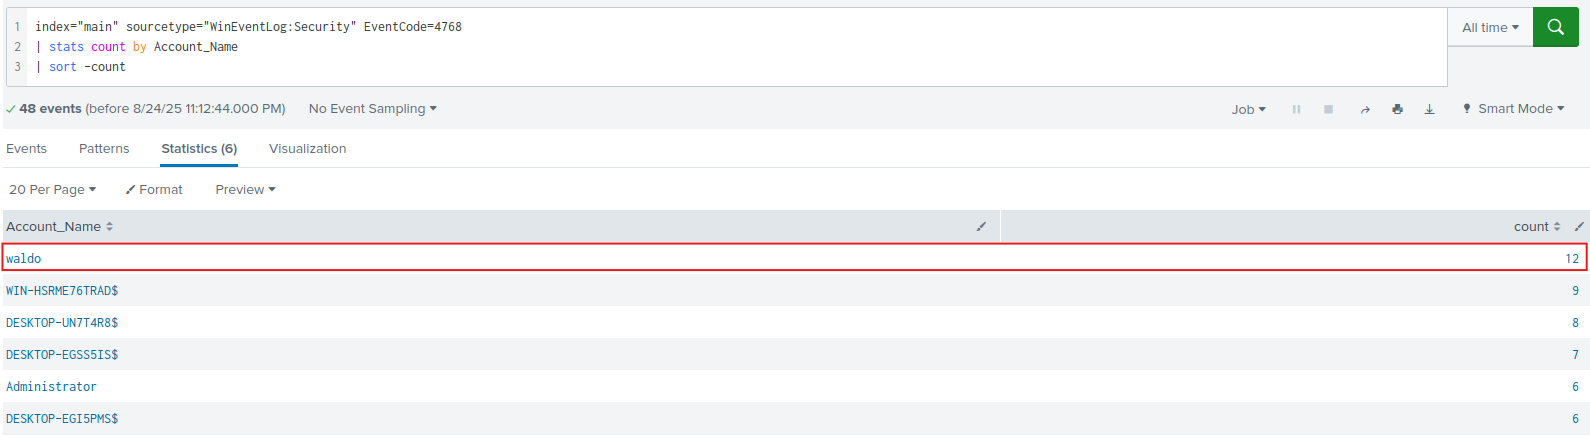
Remember, if you ever see repeated Event ID 4768 events for the same account, that could indicate automated login attempts or potential malicious activities.
The answer for this question is: waldo
Navigate to http://[Target IP]:8000, open the “Search & Reporting” application, and find through an SPL search against all 4624 events the count of distinct computers accessed by the account name SYSTEM. Enter it as your answer
Here, you want to know how many distinct computers the SYSTEM account has been used to log into. So, even if the SYSTEM account was used to log into the same computer multiple times, that still counts as one login for that computer.
Here’s the SPL query you need to answer this question:
1
2
index="main" EventCode=4624 Account_Name="SYSTEM"
| stats dc(ComputerName) as unique_hosts_accessed

So, the answer for this question is: 10
Navigate to http://[Target IP]:8000, open the “Search & Reporting” application, and find through an SPL search against all 4624 events the account name that made the most login attempts within a span of 10 minutes. Enter it as your answer
Alright, this one might really get you in the wrong direction. My first approach was to use the bin command with a 10-minute span (span=10m), something like this:
1
2
3
4
5
index="main" sourcetype="WinEventLog:Security" EventCode=4624
| bin _time span=10m
| stats count as login_attempts by _time, Account_Name
| sort -login_attempts
| head 1
That got me the following result, which turned out to be wrong:
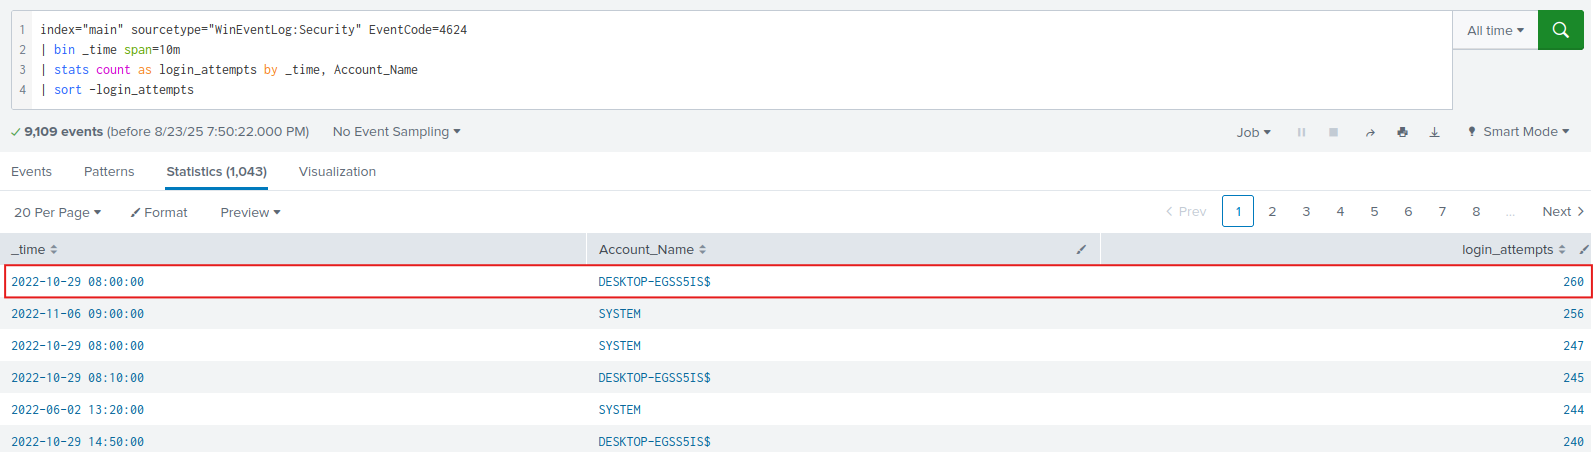
However, after reflecting on the question for a while, I realized that the phrase: “within a span of 10 minutes” has a significant meaning, you see, in the context of data analysis and statistics the term time span refers to the duration or interval between two events. For example, let’s say you have a list of a company’s daily stock prices, the time span would be the total number of days between the first day and the last day in your dataset.
In the case of this challenge, the concept is similar: you have to take all login events for one account and get the first login time and the last login time in that group, and if the difference between them is 10 minutes or less, that account will fit the criteria.
For example, an account:
1
2
3
Logins: 12:01, 12:03, 12:05, 12:07, 12:09
First login: 12:01
Last login:  12:09
Time span = 8 minutes, this account will be included. On the other hand:
1
2
3
Logins: 12:01, 12:05, 12:08, 12:12, 12:15
First login: 12:01
Last login:  12:15
Time span = 14 minutes, this account won’t be included.
Long story short, here’s how I figured this problem out:
1
2
3
4
5
index="main" sourcetype="WinEventLog:Security" EventCode=4624
| stats earliest(_time) as first_login latest(_time) as last_login count by Account_Name
| eval span_seconds = last_login - first_login
| where span_seconds <= 600
| sort -span_seconds
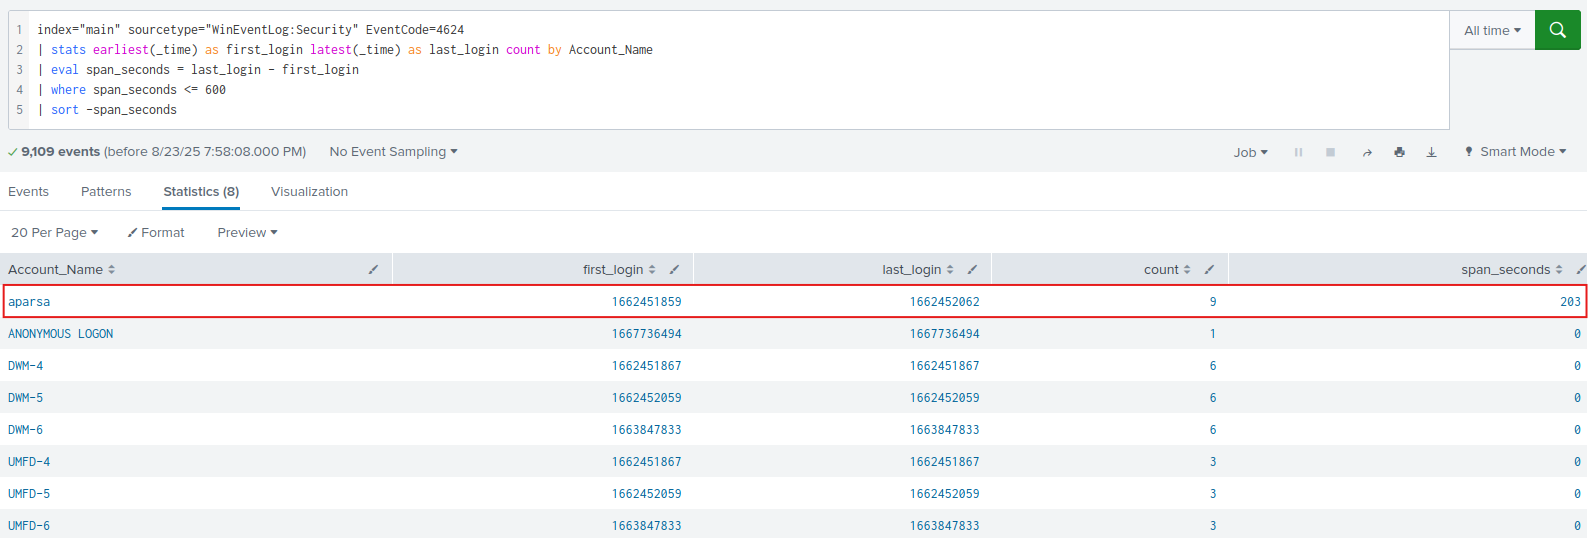
Essentially, for each account you’re calculating the difference between the first login time and the last login time, along with the total number of login events for that account. If that difference is 600 seconds (10 minutes) or less, that account will be included in the results as you can see.
The answer becomes obvious: aparsa
By working through these challenges, you’ve learned how to craft queries that reveal user activity, authentication behavior, and access patterns. Essential skills for security monitoring and log analysis 🔍. Hoping this write-up has been helpful, see you next time!.