Understanding RTT (Round-Trip Time) in Wireshark

RTT (Round-Trip Time) is the time it takes for a packet of data to travel from your computer to a destination and back. This duration is typically measured in milliseconds.
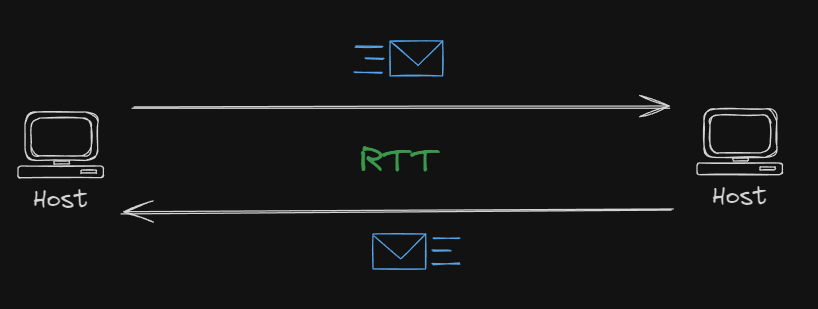
But why is this metric so important?.
Well, in real life, lower RTTs are better because packets travel to and from the destination very quickly, everything feels instant, smooth, and responsive, your web pages load quickly after clicking links, there’s no lag in your favorite online game, etc. On the other hand, higher RTTs are worse because packets take longer to complete their round trip, making everything feel sluggish, laggy, or delayed, even when you have a high-bandwidth connection.
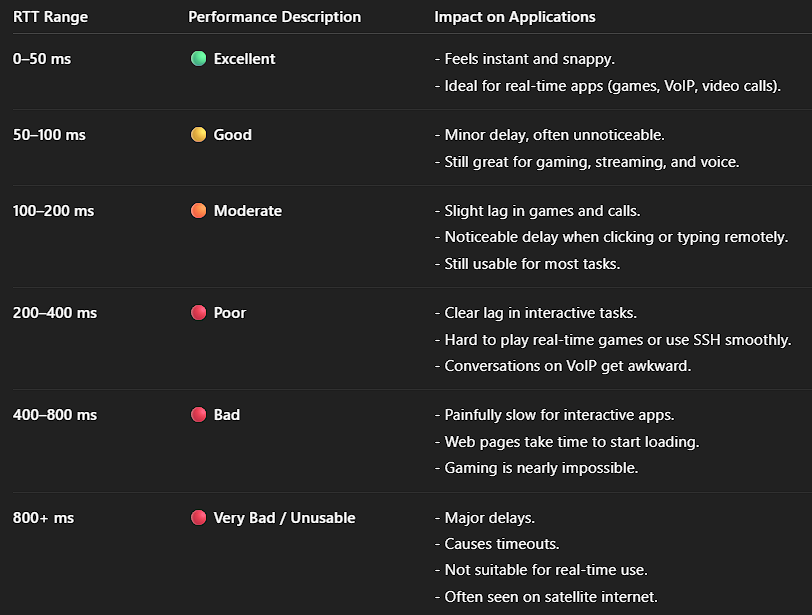
The following table can give you an idea of how RTT can affect the quality of your network communication:
When RTT Calls, Ping Answers
The easiest way to measure the RTT (Round-Trip Time) of a network communication is by using the ping command. For instance, let’s say you want to test the reachability of Google:
1
> ping -n 10 google.com -4
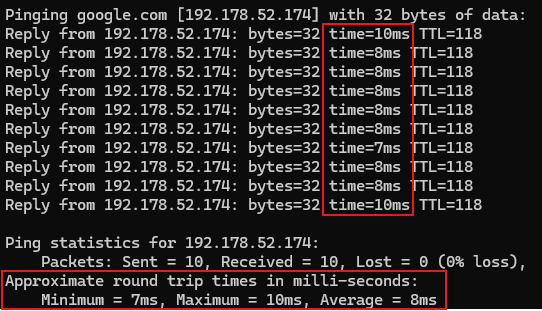
What you’re doing here is dispatching 10 ICMP Echo Request packets, each 32 bytes in size by default. As you can see, some packets return after 10ms, others after 8ms, and one after 7ms. These values are the individual RTTs for the packets.
However, when you look at the statistics, you can see that the RTT for this network connection as a whole with Google ranged between 7ms and 10ms, with an average of 8ms. These numbers indicate a stable connection (no packet loss) and a very low latency, which is a good sign.
Packets Don’t Lie, Wireshark Shows the RTT Truth
While ping is great for quick and basic RTT checks, Wireshark provides a more granular and precise way to measure RTT. You see, ping only sends simple ICMP packets and gives you a basic round-trip time when they return, on the flip side, Wireshark captures actual network traffic from different protocols (TCP, UDP, HTTP, ICMP, DNS, etc.), letting you dig into the RTT of each individual packet.
Alright, before moving on, there are two key things you should always keep in mind when measuring the RTT of packets in Wireshark:
- First, you should do it in the context of TCP streams, this way instead of getting lost in thousands of isolated packets, you keep the full picture on the current TCP session, focusing only on the conversation between two endpoints. The goal is to maintain context and build a coherent story that helps diagnose the issue effectively.
- Second, RTT only makes sense if the packet you sent gets answered. In other words, RTT can only be measured when there’s a request-response pair. You can’t compute RTT for a packet that doesn’t get acknowledged or when it lacks a response.
With all this in mind, let’s finally dive into how to measure packet RTT using Wireshark.
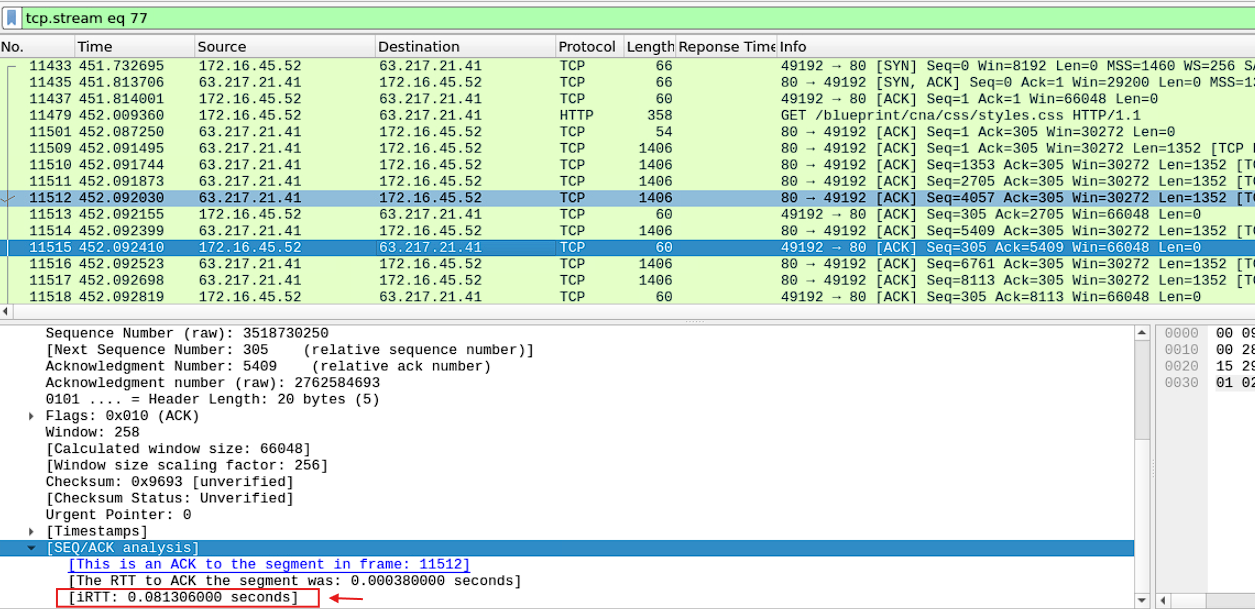
Ok, the following TCP session shows the conversation between a server and a client. Be aware that the direction of this conversation is flowing from 63.217.21.41:80 to 172.16.45.52:49192. Pay special attention at the marked spots:
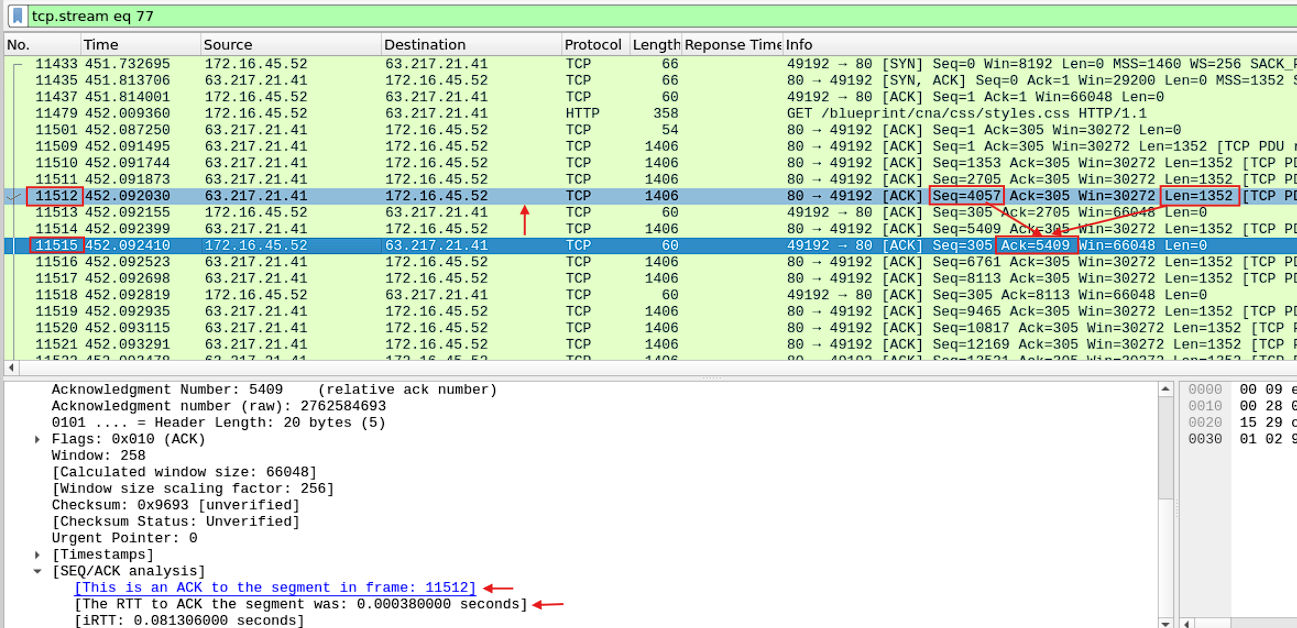
Can you see the line “This is an ACK to the segment in frame: 11512”, that’s Wireshark connecting the dots for you. It’s telling you that the frame 11515is confirming the reception of data sent by the frame 11512. That means that your packet actually got answered.
Ok, but what about the RTT?. Good news is that Wireshark also does that heavy lifting for you. See the legend: “The RTT to ACK the segment was: 0.000380000 seconds”?, that’s your RTT right there. Let me get this clear for you: The server in packet 11512 sent 1352 bytes of data, then, the client in packet 11515 acknowledged the reception of all those bytes (ACK=5409). So basically, the time for the whole trip (or RTT) for that exchange was about 0.38ms (0.000380000s).
Alright, now that you know how to measure packet RTT using Wireshark, you might be wondering: what exactly is iRTT?.
The Wireshark initial Round Trip Time or iRTT is a value calculated during the TCP 3-way handshake. It is simply the time it takes for a SYN → SYN-ACK → ACK sequence to complete:

Ok, but where is the iRTT of 0.081306000 seconds? You don’t see it anywhere yet. To view this value, select the initial packet of the TCP conversation (the one with the SYN), right-click on it, and choose Set/Unset Time Reference. The result is the following:
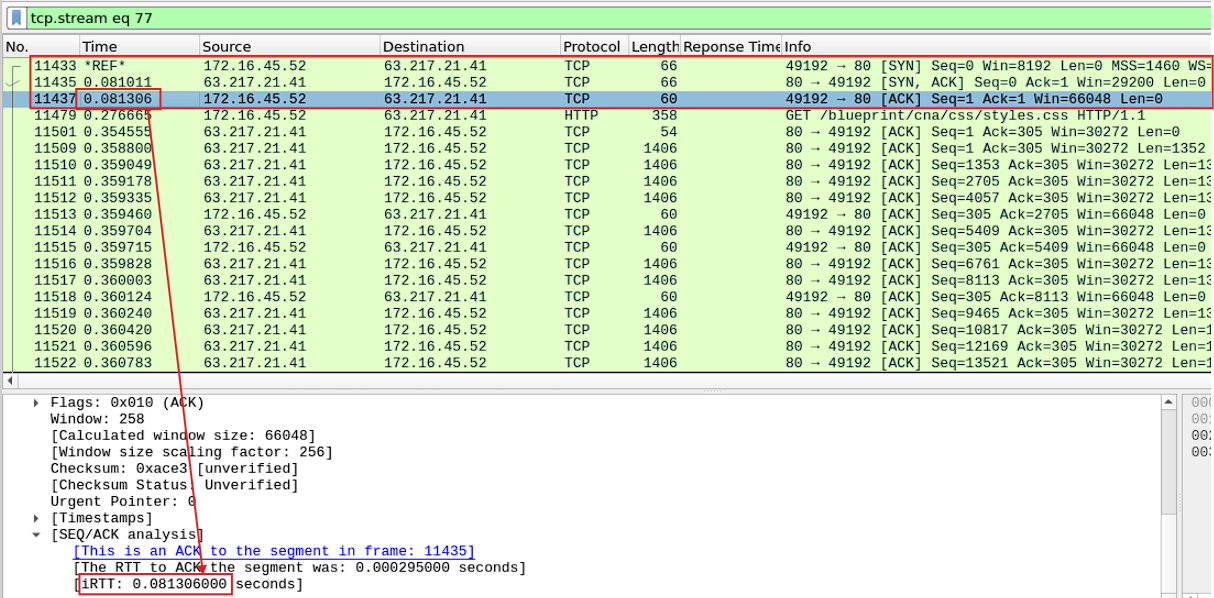
There’s your magic number.
Remember, the iRTT is measured only once at the start of a TCP connection and stays constant for the life of the TCP connection.
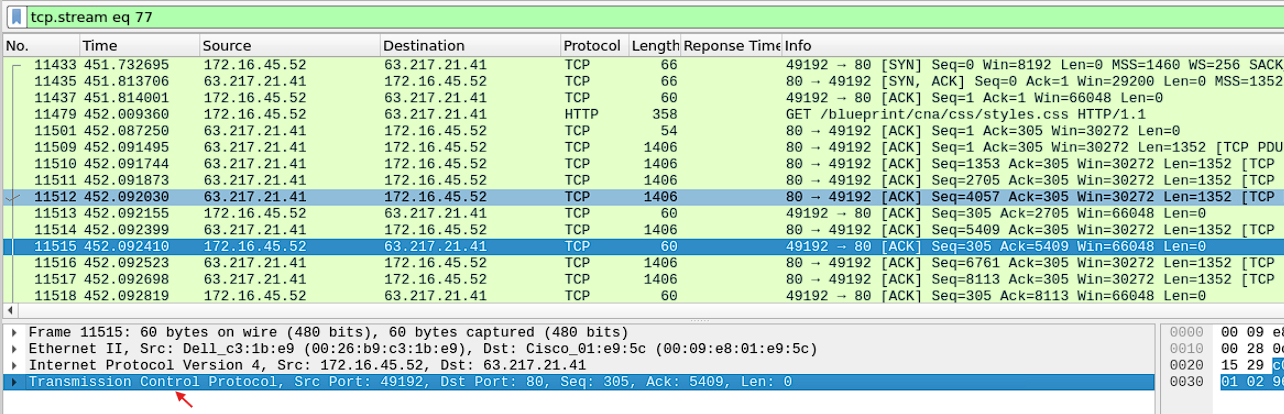
By the way, you can find the iRTT and RTT values within the TCP encapsulation layer of the frame. However, as mentioned earlier, the RTT metric is only available for packets that actually received a response:
Alright, you already know how to measure the RTT for individual packets, which is useful, but what if you want to evaluate the RTT for an entire TCP session?.
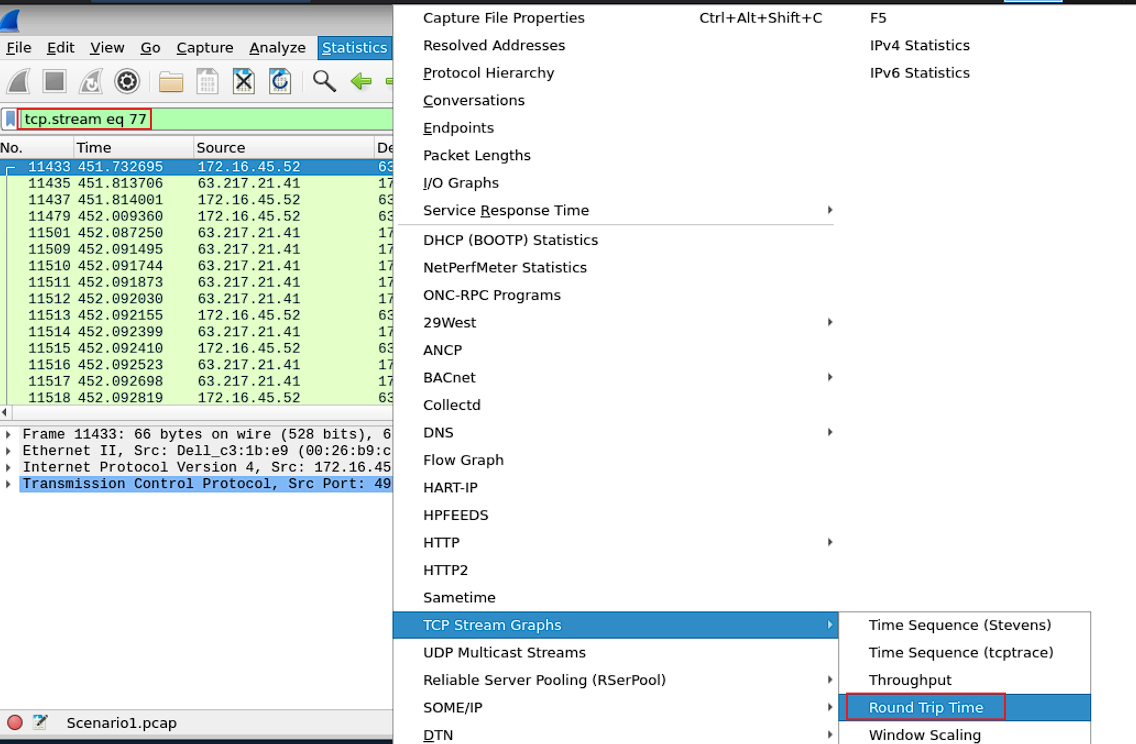
For that, you can use the Round Trip Time Graph which shows you the round-trip times for all packets in a TCP session, this way you can evaluate the session’s overall latency and performance, rather than just individual packets.
Simply head to Statistics → TCP Stream Graph → Round Trip Time Graph:
And you’ll get the following Graph:
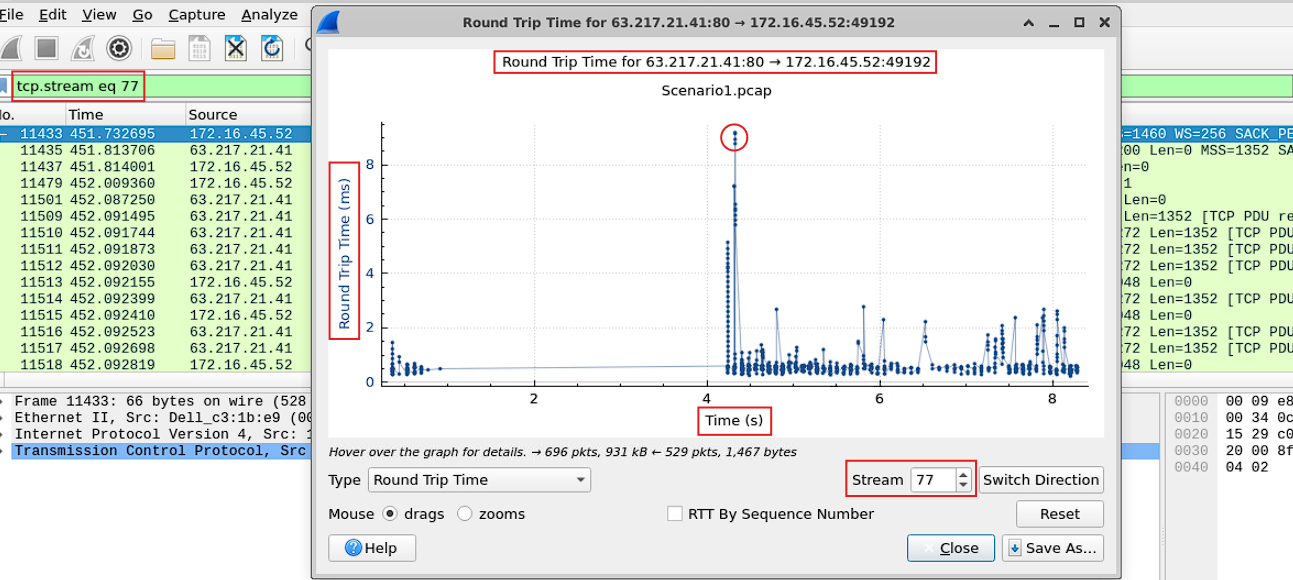
Let me break it down for you:
- The title confirms the traffic direction: from the server
63.217.21.41:80to the client172.16.45.52:49192. - The X-axis (Time) is simply the timeline of the TCP stream. It is measured in seconds.
- The Y-axis (RTT in ms) shows the RTT for each server-to-client data packet.
- Each dot represents one data packet from the server (
63.217.21.41:80) being acknowledged by the client (172.16.45.52:49192).
In a nutshell, this RTT graph shows how quickly the client acknowledges the server’s packets for this TCP session. For the first 4 seconds, the RTT is low and stable, meaning acknowledgments are fast. At around 4 seconds, there’s a noticeable spike to ~8ms. After that, the RTT values fluctuate more but remain remain low (under 3ms most of the time), which is ok for a sustained data transfer. In general, this TCP connection is healthy, with minor transient delays.
By looking at round-trip times, you can spot slow connections, figure out where delays happen, and make sure your traffic flows smoothly. Keep an eye on the whole session, not just single packets, and you’ll get the full story of what’s happening on your network. Hope you found this article helpful. See you next time!.😉